


A week ago, the bitcoin course shot up like a rocket after our course analysis. Bitcoin rose by more than 40 percent, the largest daily price increase since 2011. For a moment, the value of 9,500 euros was tapped, but that was only for a short period. The exchange rate is now around 8,200 euros.
Movement was already coming
But first a look back. Could we see this price movement of last week coming? The answer is yes. Below you can see the bitcoin price chart at day level, from May to November:
The indicator that you see is the Bollinger Bands. If the space between the top and bottom becomes smaller, the chance is greater that the course will break out. You also call this a Bollinger Squeeze. The bandwidth is, as it were, compressed and then the course must choose a direction.
For a moment it seemed that this outbreak would be down, but bitcoin recovered well. After a price explosion of more than 40 percent, we are now a lot higher than last week.
The indicator says nothing about the direction of the outbreak. As you can see on the graph, a decrease as well as an increase can occur.
Koers now finds support ..
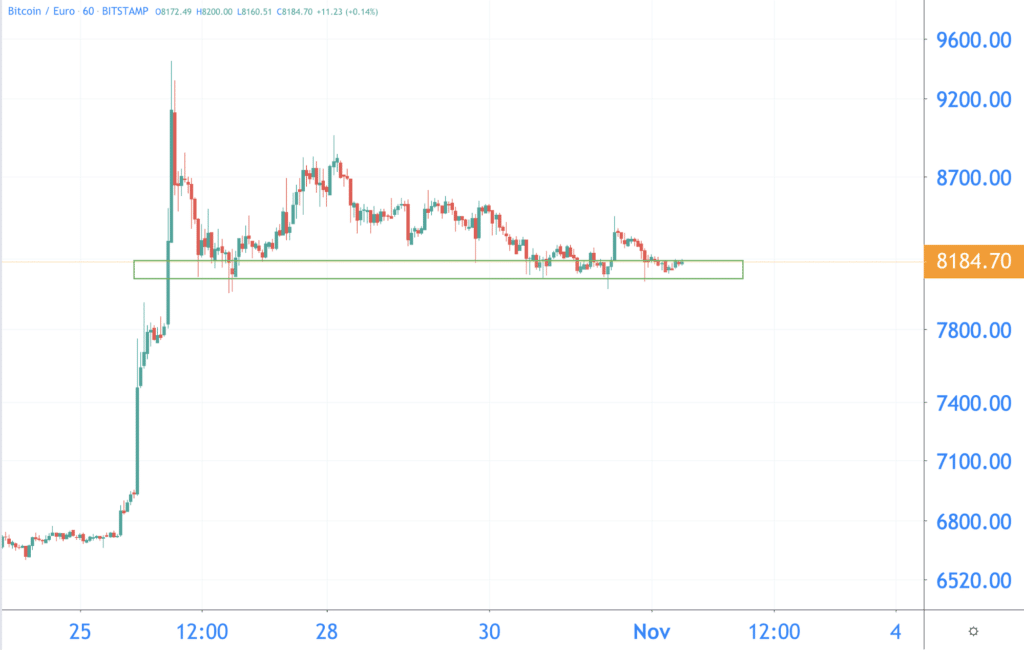
We zoom in on the graph. Each candle now represents an hour. What happened after the big outbreak last weekend?
The bitcoin rate fell by more than 15 percent on Saturday. That is actually not surprising, after such a large increase you can also expect a correction.
Then the course moved mainly sideways. It is currently difficult to say which direction the bitcoin course is taking. Indicators such as the RSI and the MACD are remarkably neutral.
On the positive side, the value of bitcoin is still a lot higher than last week.
And with this support we are back!
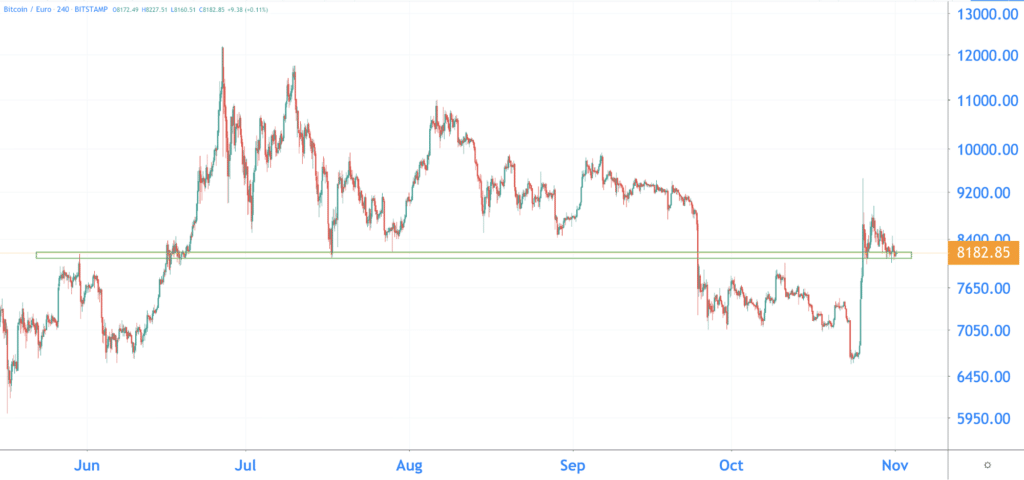
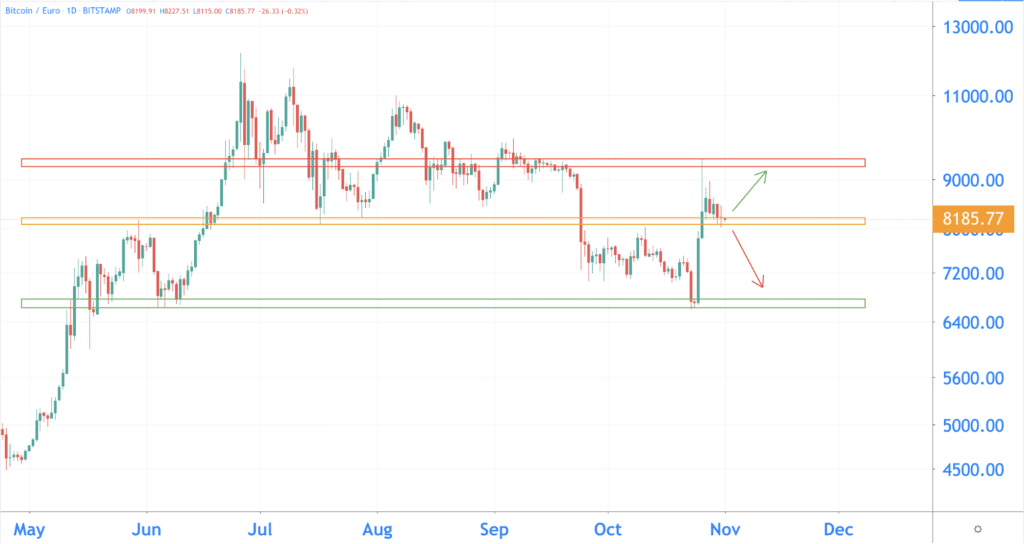
We zoom out again on the graph. You now look at the bitcoin rate from June to the present.
At the end of September, bitcoin fell through the lower limit. And that went fast, in 15 minutes bitcoin lost ten percent in value. But after the explosive growth of last week, bitcoin is back again.
The price is now above the strong support (see the green bar) of the past months. And that can be a good sign. We can now focus a little more upwards. € 12,200 is the high point of 2019, which is increasingly coming into view.
Bitcoin on a silk thread
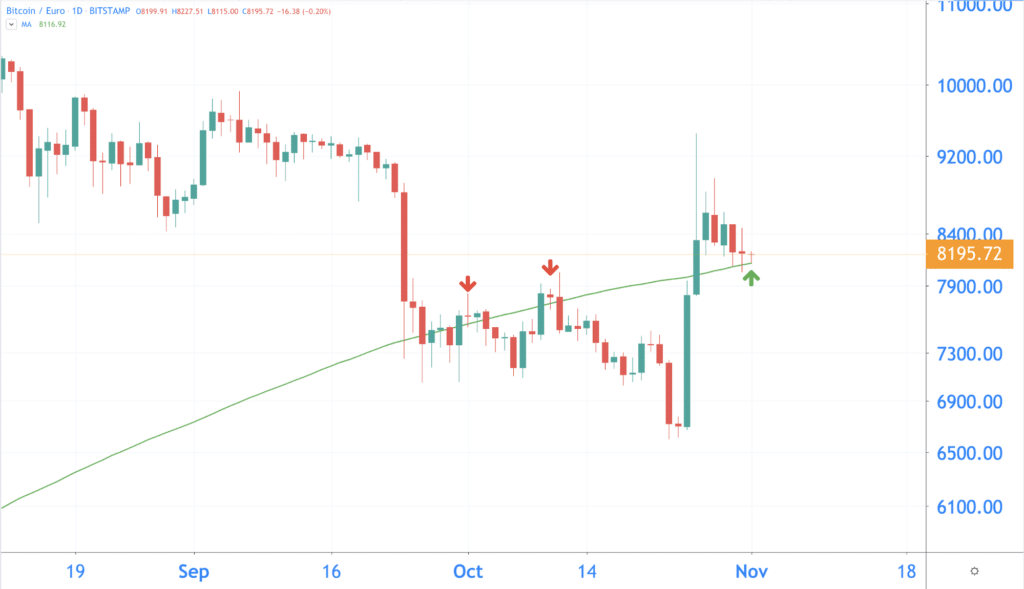
And that thread is the 200-day Moving Average. During our price analysis on Tuesday, the price was still above this line, but now bitcoin seems to be testing the line.
The 200-day Moving Average is often quoted by analysts to decide whether an asset is in a bull or bear market. The coming days will also be exciting. Does bitcoin stay above the line? Then the bull market remains intact and we can expect a structural increase. We’ll keep an eye on it for you!
What can we expect from bitcoin?
In the coming days it will be exciting whether the bitcoin course can defend the 200-day Moving Average. If that succeeds, bitcoin is in good shape.
Furthermore, our expectations for today remain the same as Tuesday. The price of bitcoin has not changed much in the meantime. As you are used to from us, we sketch two scenarios again.
Bullish
Last week’s summit in the night from Friday to Saturday (9,500 euros) can form a new resistance. We indicate that resistance with the red bar. Will the course succeed in overcoming this level? Then we can look further. In our previous analysis we discussed that 10,000 euros could be a possible level.
Bearish
Does bitcoin fall below the 200-day MA? Then the rate in our most negative scenario falls to 6,700 euros. We have drawn that zone with the green bar. This scenario seems very pessimistic, but with bitcoin it can go either way. We do expect that bitcoin can find support there.
Winner Ledger Nano S: Kilo Bravo
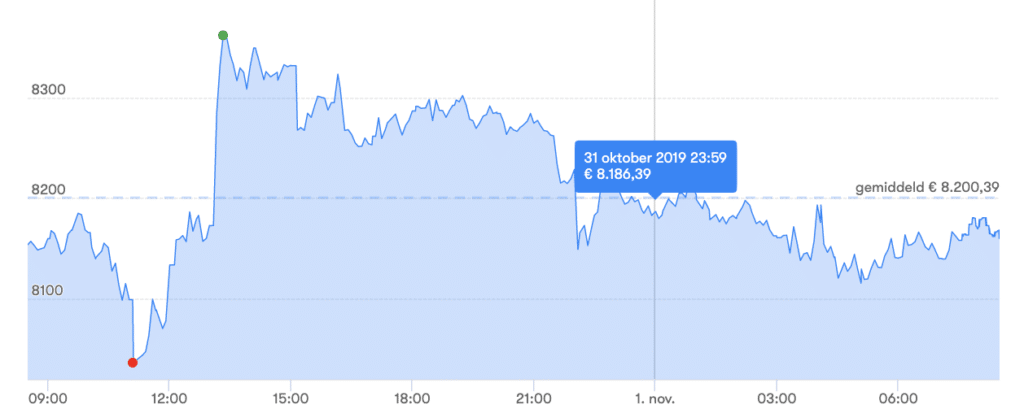
Alpha Bravo Charlie, roger that! Last Tuesday we announced that you could win a Ledger Nano S. Kilo Bravo has responded and was closest with a prediction of 8197 euros. Congratulations!
On October 31 at 23:59 this was the course on our course page:
Related posts:
 Why do cryptocurrency Exist – Institutions
  Bitcoin and independent property rights
  NASDAQ on market manipulation: Everyone is now talking about regulating bitcoin and cryptocurrency
  Pilot Porsche on Ethereum blockchain to trace provenance materials
  Xfers from Singapore is going to use blockchain Zilliqa
  Make your own tokens with the Guarda wallet


