


At the beginning of this week, bitcoin was still in a rising trend, but now the price seems to be moving more sideways. Is bitcoin still breaking out this weekend? Or will bitcoin continue to continue this way for the time being?
And do you want to win a Ledger Nano S hardware wallet? Then predict the race, and who knows you might be the lucky winner! These are the rules:
- Guess the bitcoin (BTC) course of a.s. Friday August 16 at 12:00 noon.
- It is about the bitcoin rate in euros.
- Respond to the YouTube video below to participate.
- Edited responses are not included
You have until Tuesday, August 13 at 5:00 PM to make a prediction. We will contact the winner on Friday 16 August. Good luck!
Bitcoin to zero ?!
You look at the bitcoin rate at day level, and as you can see it is not going well now:
No kidding, this is the price of bitcoin but then the other way around. And although it sounds strange, this graph can also provide you with valuable insights.
The graph is reversed, so all tops are now changed to bottoms. The green rectangles on the graph are the highest values of bitcoin. And you recognize a bear market because the price on this graph bounces up from the green rectangle.
It takes some getting used to, but you can see a pattern in it. The price of bitcoin seems to be moving “downwards” in stages. The price of bitcoin is now on the third step. When will we go further down? ?
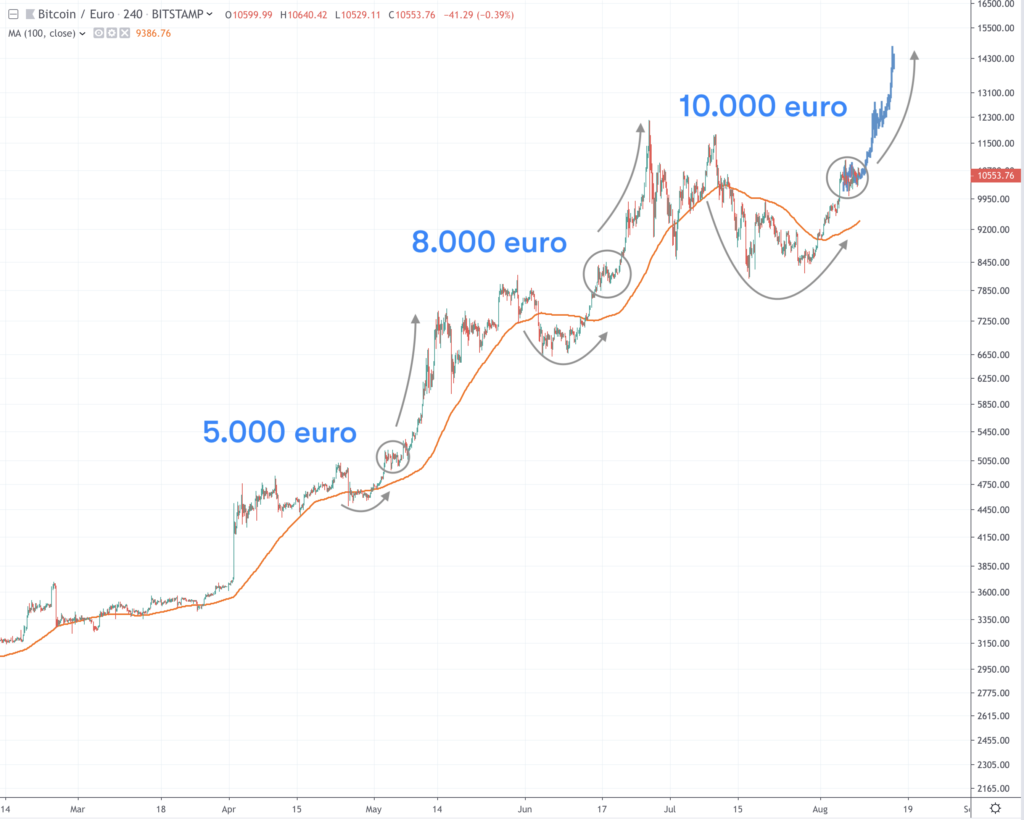
Pattern in recent weeks can cause an increase
Did you start the opposite way? No worries, we will now continue with the normal graphs. Below you can look at the bitcoin four-hour graph. Each bar on the graph therefore represents four hours.
We wrote earlier that the price of bitcoin is moving in a striking pattern.
- The graph below shows that the price plunges several times below the 100 Moving Average (MA) line. You can recognize the 100MA line by the orange line on the graph.
- This is followed by a period of lateral movement (circles on the graph).
- Then the course climbs to a higher level.
On the graph below we have copied the price movement from the last complete pattern to the current price. The blue course at the end is therefore not yet the actual course, but a prediction based on the previous patterns.
Does bitcoin follow the same pattern this time too? Then it may well be that the value of bitcoin will increase considerably in the coming days. In this example we anticipate an increase to 14,800 euros. But it remains bitcoin, so nothing is certain.
Relative Strength Indicator also positive
Another indicator also indicates that the bitcoin rate may grow in the near future. This is the Relative Strength Indicator (RSI), which displays the momentum of the price. You can see the RSI on the bottom graph.
This seems to find support during the periods that the course moves sideways (orange line under the course chart). You can see that on the bottom graph on the green rectangle. Bitcoin can rise again from there.

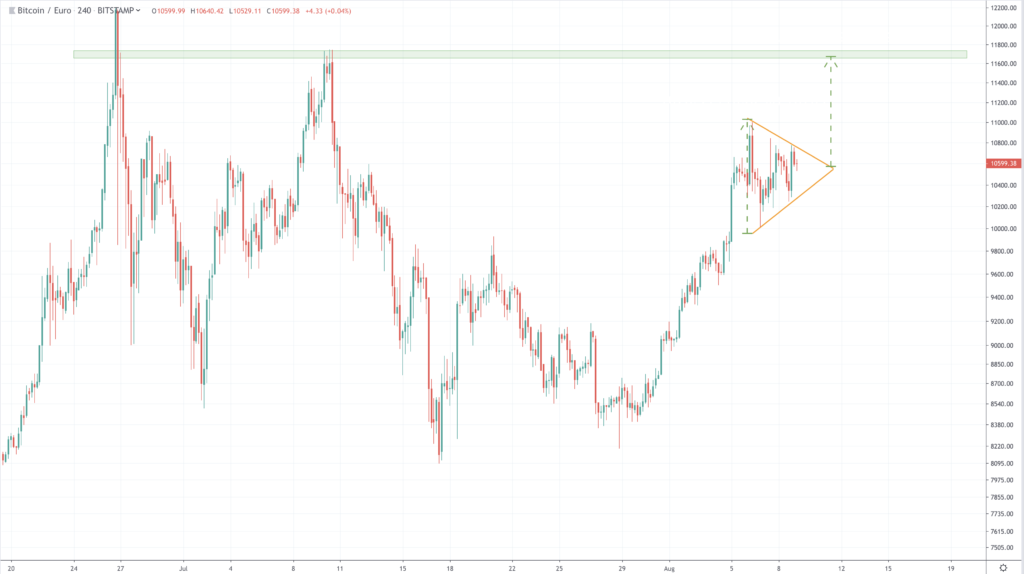
Symmetrical triangle indicates a possible rise
Another bullish signal is that the price of bitcoin is currently moving in a symmetrical triangle. The graph shows that the value of bitcoin now appears to be trapped between two trend lines that move towards each other.
Does the price of bitcoin break out at the top of this triangle? Then we can expect a substantial increase in the price. The expected increase is then approximately as large as the “opening” of the triangle. Bitcoin can then go up to 11,700 euros.
But if bitcoin breaks out on the other side, then the drop is just as big as the opening. In that case, bitcoin drops to 9,600 euros.
Where can we expect from the bitcoin rate?
Do we combine all these graphs? Then you get what you see below. As always, we continue to describe two scenarios. Because of course it remains bitcoin, so it can go in any direction.
Bullish
If bitcoin breaks out of that beautiful triangle, we can expect an increase towards 11,700 euros. In the first instance, the exchange rate may encounter some resistance there. This zone is located around the old top of Wednesday, July 10 (lower red rectangle).
Does bitcoin climb further along the blue course? Then bitcoin rises to the highest value of 2019, namely 14,800 euros. That is starting to get closer to the All Time High.
Bearish
Is bitcoin breaking out at the bottom of the triangle? Then bitcoin will probably first drop towards 9,700 euros. It is quite possible that bitcoin will find support there, since this has turned out to be an important zone in recent weeks. On the graph you can see this support on the orange rectangle.
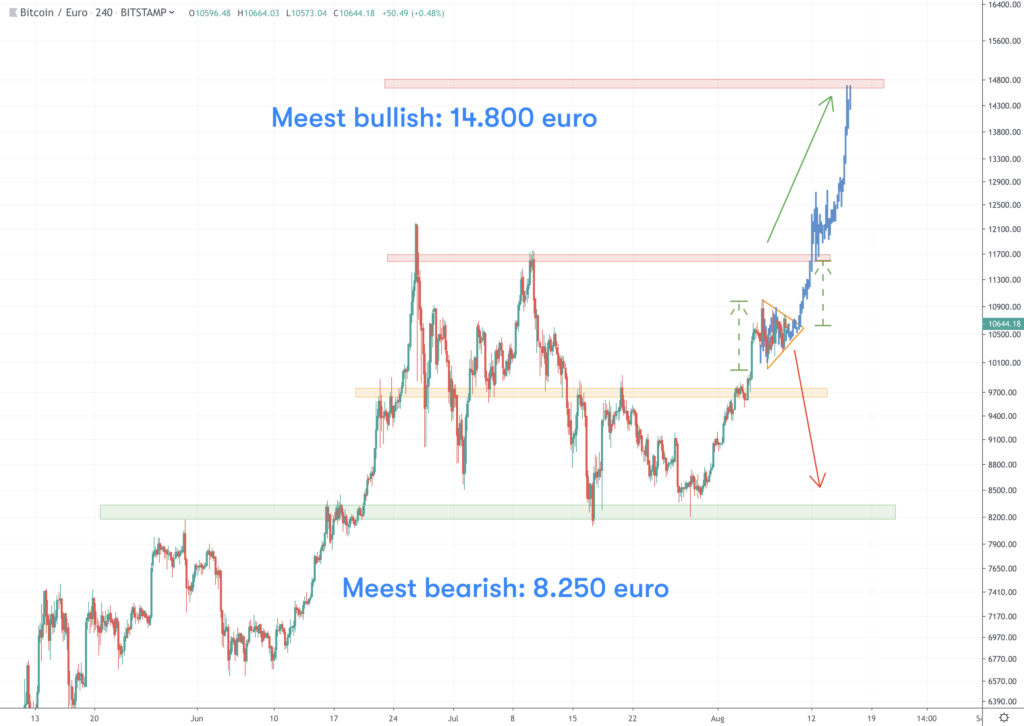
But does the rate fall further? Then the price of bitcoin searches for the bottom of 17 June, 17 July and 28 July. This bottom is around 8,250 euros (green rectangle on the graph).
Related posts:
 Why do cryptocurrency Exist – Institutions
  Bitcoin and independent property rights
  NASDAQ on market manipulation: Everyone is now talking about regulating bitcoin and cryptocurrency
  Pilot Porsche on Ethereum blockchain to trace provenance materials
  Xfers from Singapore is going to use blockchain Zilliqa
  Make your own tokens with the Guarda wallet


