


Bitcoin seems to be recovering somewhat since the fall of Tuesday last week. Bitcoin has even risen by ten percent from yesterday’s lowest point! What drove this price rise? And what can we expect from the bitcoin rate this week?
Divergence leads to an increase in the rate
One of the factors that contributes to the rise is divergence between the price and the RSI. Divergence means that the price shows increasingly lower bottoms, while the RSI produces higher bottoms. That is usually a precursor to a recovery.
You can see this divergence on the graph below. You see a falling trend line on the bitcoin rate and a rising trend line on the RSI.
Want to know more about indicators such as the RSI? Then view this page for more information.
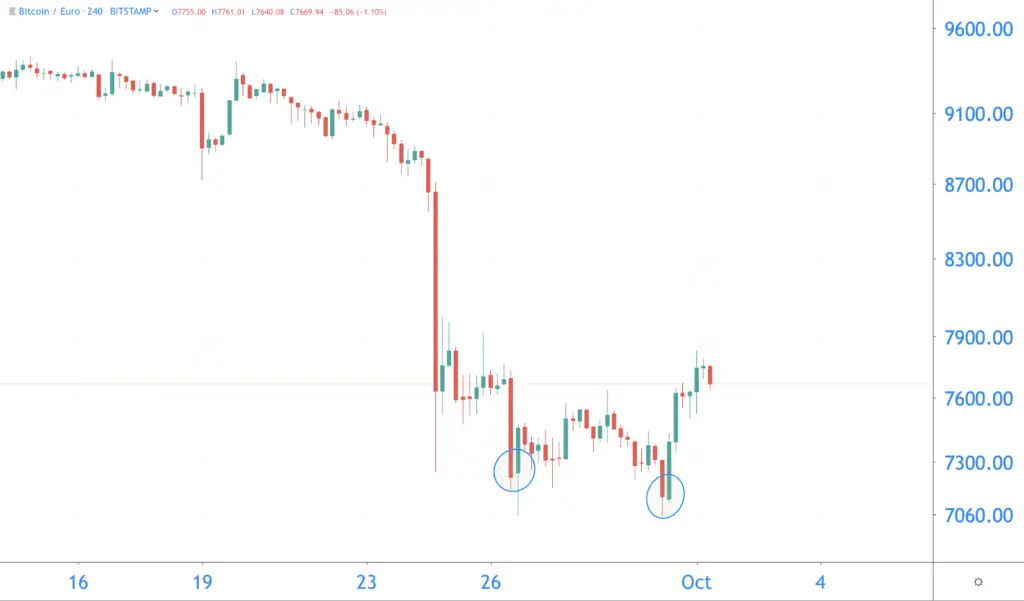
Double bottom also positive
Another positive sign is that the price has formed a double bottom. And that is usually a signal for a further rise in the price. Along with the divergence we just discussed, this was probably the advance for yesterday’s rise.
You can see the double bottom when you set the price chart to four o’clock:
On the way to an important support point
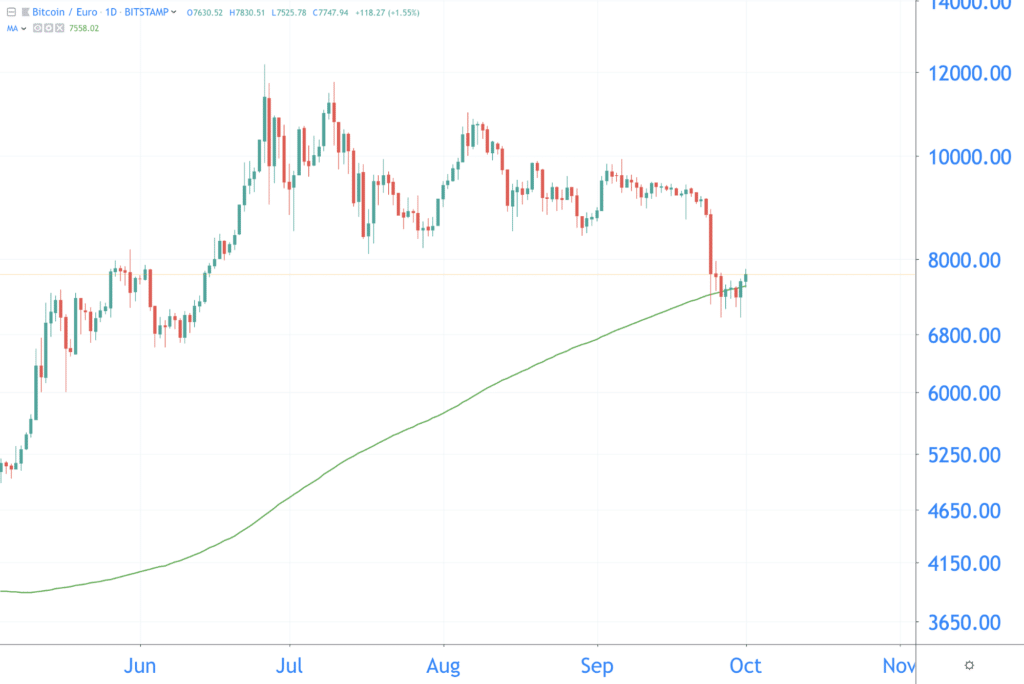
The last days, all eyes are focused on the 200-day Moving Average (MA). Many analysts state that you can speak of a bull market if the price is above this line.
To keep the rising trend intact it is therefore important that the bitcoin price is above this line. And that is now also the case on the euro chart:
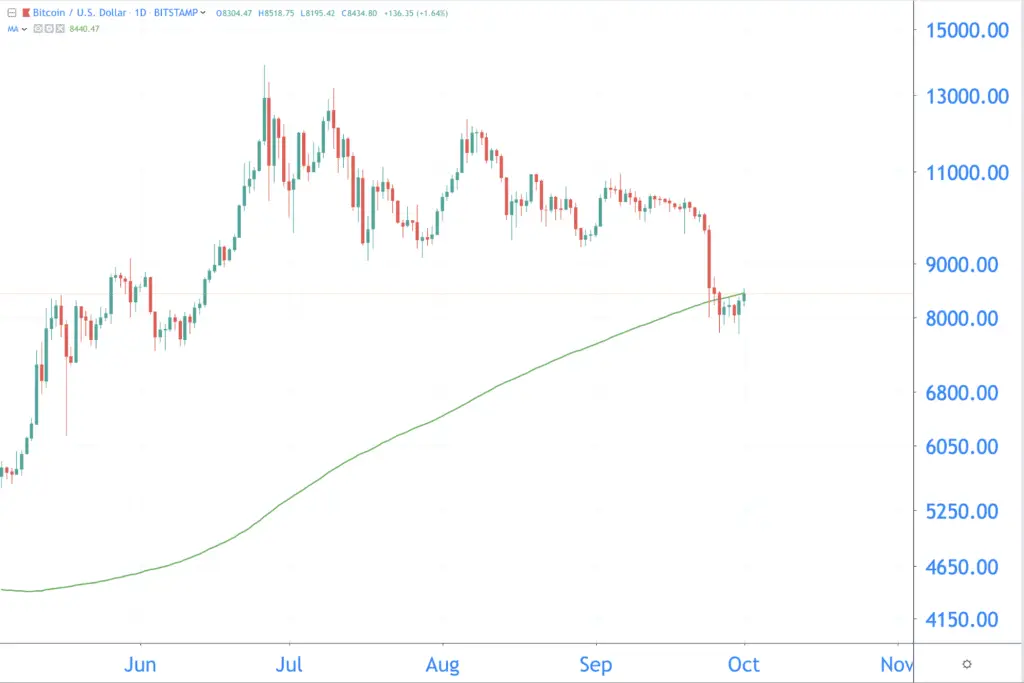
Yes, we are going to rise again! Or not? The dollar chart shows that the price of bitcoin is still moving below the line:
And then the price of bitcoin also differs between stock exchanges. The truth is probably also in the middle.
The rate of bitcoin is now moving around the 200-day MA. Only if the price makes a convincing move up or down can we say something about the price development in the longer term.
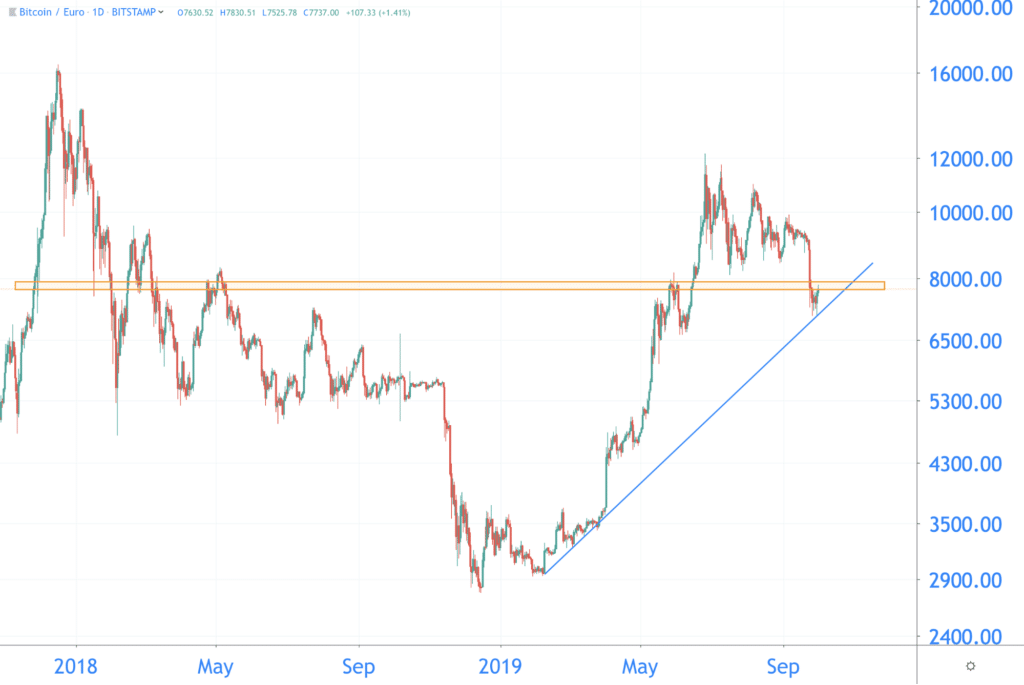
Zoomed out: bitcoin returns to the old trend line
Is bitcoin suddenly in a downward trend again? That is not necessarily necessary. In fact, it may even be that the course has returned to an old trend line. We have drawn that trend line in blue on the graph.
Does bitcoin continue to follow this trend line? Then the course must first overcome an important resistance. You can see this resistance on the orange bar on the graph, between 7,700 euros and 7,800 euros. In the beginning of 2018 and in May 2019 this zone was relevant, and now it can also be a barrier:
Where is the bitcoin course going now?
Bitcoin seems to have started the recovery carefully again. But anything can happen in the cryptomarket. That is why we take a positive (bullish) and a negative (bearish) scenario into account.
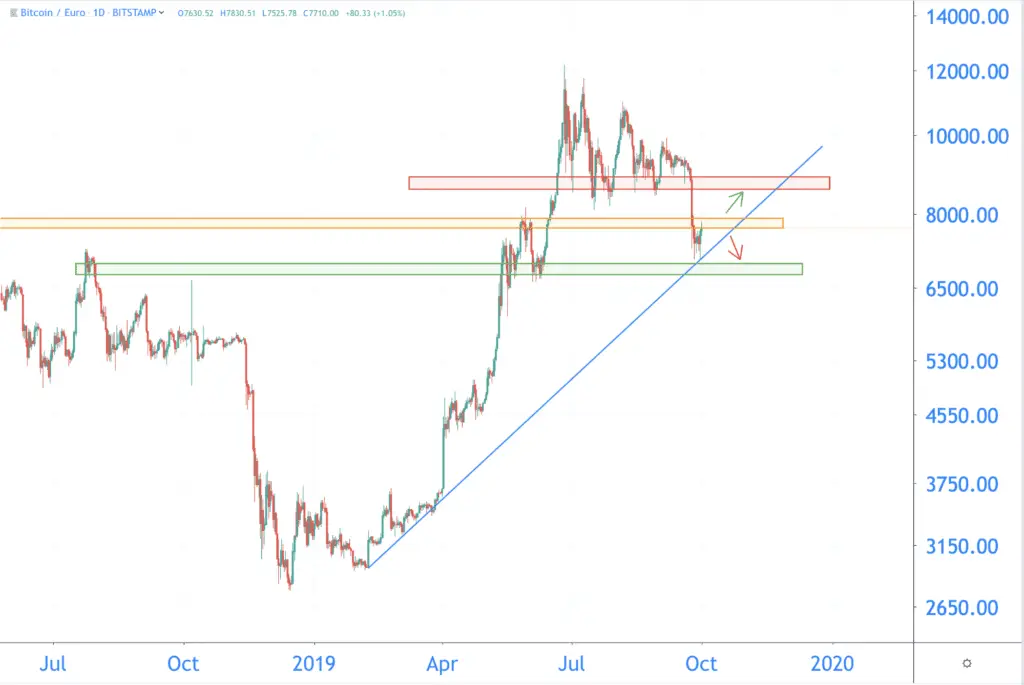
Bullish
The course overcomes the resistance and rises further. But around 8,700 euros we find a strong resistance (in the red). This zone has been important in recent months, and this level can again become relevant.
Bearish
If bitcoin breaks through the bottom of the trend line, we will find the first support at 6,800 euros (in green). In the most pessimistic scenario, bitcoin drops to 5,500 euros, which was an important support throughout 2018.
Related posts:
 Why do cryptocurrency Exist – Institutions
  Bitcoin and independent property rights
  NASDAQ on market manipulation: Everyone is now talking about regulating bitcoin and cryptocurrency
  Pilot Porsche on Ethereum blockchain to trace provenance materials
  Xfers from Singapore is going to use blockchain Zilliqa
  Make your own tokens with the Guarda wallet


