


In our analysis of Friday, we wondered if bitcoin could rise to 12,000 euros. We are certainly on the right course! How different it looked last week. On Tuesday, July 30, bitcoin was barely worth 8,500 euros. Bitcoin has since risen by more than 30 percent.
You cannot actually see that rise apart from all global developments. The trade war between the US and China is about to escalate. And for the first time in the history of bitcoin, interest in the US is being lowered. It is an assumption, but these developments may provide a refuge in bitcoin.
But in this article we look purely at the graphs. What can we expect from the bitcoin rate?
A bull flag is about to break out
The bullish scenario of past price analysis has come true. The value of bitcoin has risen to the top trend line of the possible bull flag.
A bull flag, what’s that again? In short, a bull flag consists of two parts:
- The pole. First the value of bitcoin rises sharply. We have indicated this increase on the graph with the first green line.
- The flag. After that, the price of bitcoin moves downwards between two trend lines. You can also see that on the graph below.
Does the value of bitcoin break from the upper slanting trend line? Then it can sometimes go fast. The possible rise is then as large as the pole of the bull flag. An increase of a few thousand euros is then even conceivable.
But at the moment it is exciting, the value of bitcoin rubs against the trend line. It sounds cliché, but it can still go anywhere.
Price increase is supported by number of transactions
What also makes this increase special is that it is different from a few weeks ago. The growth of the rate is actually supported by the transaction volume on the bitcoin network. That was not the case with the previous increase.
You can see this on the NVT indicator (bottom graph). N / A stands for Network Value in relation to Transactions (in dollars). In simple words the NVT shows the ratio between the bitcoin price and the daily use on the blockchain.
Is the NVT in the red zone? Then the price is actually too high in relation to the transaction volume on the blockchain. Below the red zone means a healthy ratio between price and transactions.
What is striking is that the NVT was in the red at the end of June. Relatively few transactions took place on the blockchain back then. Now the price increase seems to be more supported by the volume of all transactions on the blockchain.
The NVT is now a bit below the red zone. The increase from now on is therefore different from a month ago. And that is a positive sign, the price increase is in a healthy relationship with the transaction volume.
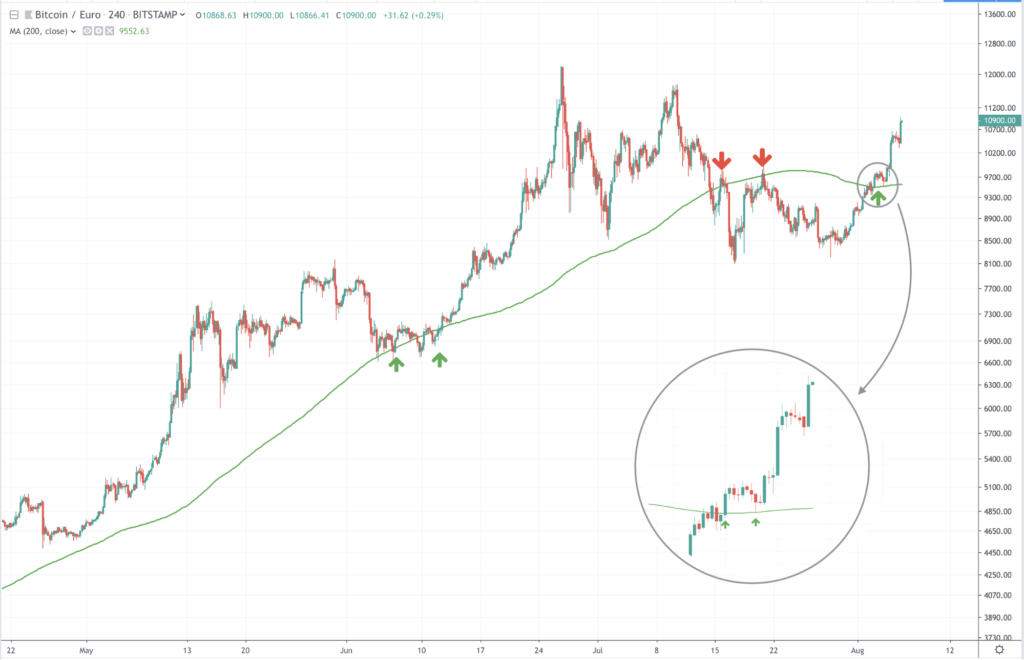
Moving average provides support again
In our analysis of Tuesday, July 23, we also wrote about the moving average (MA). The same line is now relevant again. Instead of a resistor, the MA is now a support again.
You now look at the bitcoin four-hour graph, and the green line is the 200MA. An MA displays the moving average of a specific time period. In this case two hundred time units of four hours. That seems random, but this line is often used in technical analysis.
That the MA now forms a support is positive. This can be the start of a long-term rise. At two intervals, the price of bitcoin has been above this line since February 2019.
The graph below also shows that the MA has been tested twice. That means that the rate looks up the line for a while, and then continues to rise. You can see this movement zoomed in in the circle on the image.
What can we expect from the bitcoin rate?
It looks very positive for the bitcoin rate. We couldn’t say that before! But the ball is round, so we look at two scenarios: bullish (positive) and bearish (negative).
Bullish
In the positive scenario, the bitcoin course manages to break out of the huge bull flag. In that case, the rise in the rate is virtually the same as the bull flag pole. That means a considerable increase towards 15,600 euros. Wanted? That is not necessary, it remains bitcoin of course.
Will the bitcoin succeed in achieving this prize? Then bitcoin may soon reach its highest price ever ..
Bearish
But does the bitcoin fail to break out of the bull flag? Then first all eyes are on 9,700 euros. That is the orange rectangle on the graph. This zone has been a clear resistance and support zone in recent months.
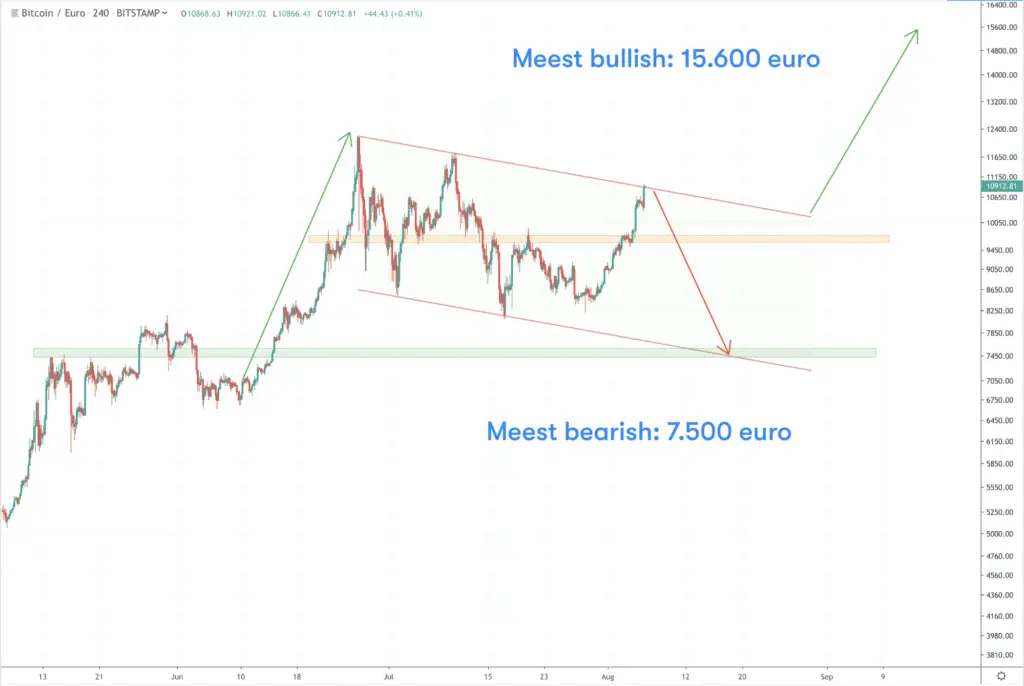
Is bitcoin falling even further? Then the rate probably finds support at the bottom of the bull flag. Then you have to think of a value of 7,500 euros.
Related posts:
 Why do cryptocurrency Exist – Institutions
  Bitcoin and independent property rights
  NASDAQ on market manipulation: Everyone is now talking about regulating bitcoin and cryptocurrency
  Pilot Porsche on Ethereum blockchain to trace provenance materials
  Xfers from Singapore is going to use blockchain Zilliqa
  Make your own tokens with the Guarda wallet


