


In this price analysis we focus more on long-term investors and HODLs. We zoom out a little further than you are used to. And yes, we will be very bullish about the bitcoin course.
More than 90% positive
Let’s start with a bold stat. The graph below shows that there are actually only two buying moments in the history of bitcoin, so that your investment is now in the red.
Above you see a logarithmic representation of the dollar rate of bitcoin. We chose to use dollars because you can look further into the past. It may be obvious, but if you had bought during the green periods, you are now on a profit. The two (actually three but we do not count the latter) red zones are not included if you compare it to the entire bitcoin history.
This means that 93% of all months are green. In other words, the price of a bitcoin is now higher than during 93% of the history of bitcoin. We know that many people bought bitcoin for the first time in late 2017, early 2018, because of FOMO. And all these people must now be considerably less, right?
That is not necessarily necessary. Suppose you had bought your first bitcoin at the absolute top of $ 20,000 on December 17, 2017, and you would deposit the same amount every month, you still have 26.5% profit. If we assume an amount of 100 dollars x 23 months, then you have invested 2,300 dollars. You will receive a little more than 0.35 bitcoin in return. At the moment that is worth $ 2,909. A decent profit of 600 dollars.
The lesson (and also a disclaimer because this is not buying advice): it is safer to periodically invest a little instead of once a large amount. This is called DCA, or Dollar Cost Averaging.
Falling Wedge
For the following graph we switch again from the dollar to the euro. We’re going to talk about the falling wedge.
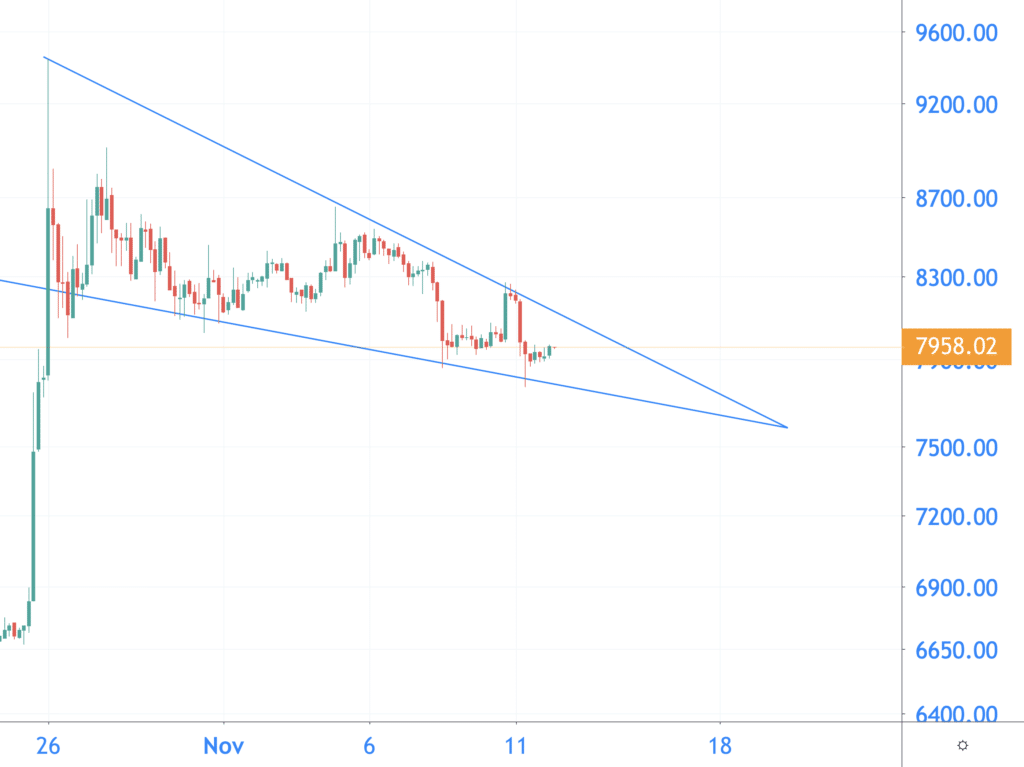
The falling wedge is a bullish continuation patern. That actually means that the positive sentiment is not over yet. The buyers are still winning.
What you see above is that enormous growth spurt of 45%. The bitcoin rate responded to the positive statements by the Chinese president about blockchain. Then you see that the buyers catch their breath and take it easy. The two trend lines of the falling wedge move towards each other and the course should break out here in the coming weeks.
The past teaches that if the price at the top of the falling wedge breaks out, the growth is comparable to the growth prior to the wedge.
The bottom trend line is also an interesting one. This is not only based on the short term, but has been visible since July. You can see that in the graph below.
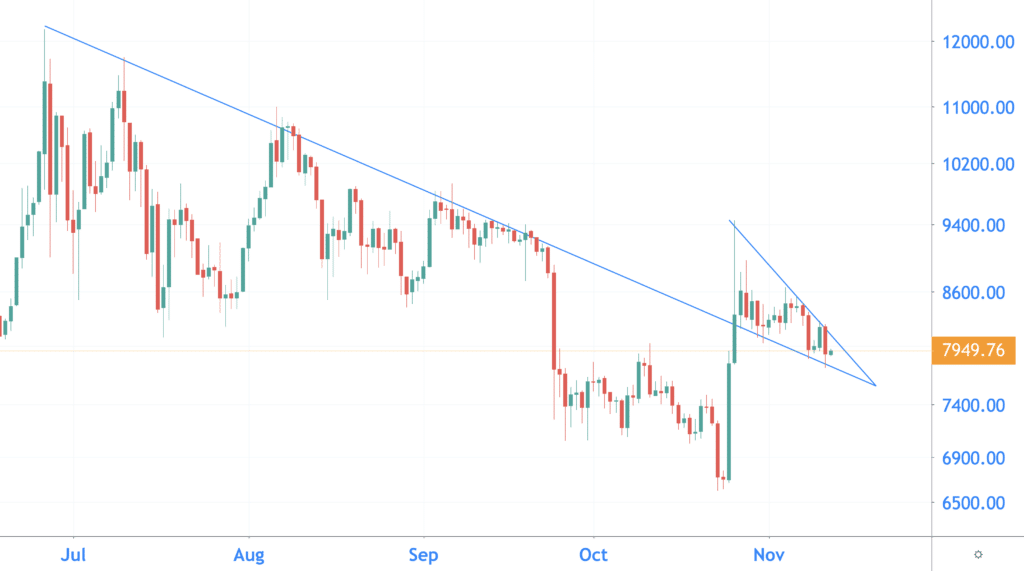
From July you can draw a trend line over the tops of the course. For a long time, that line was a resistance that the course could not break through. Once the course broke out, the trend line turned into a support.
The best days are scarce, gotta catch ‘em all
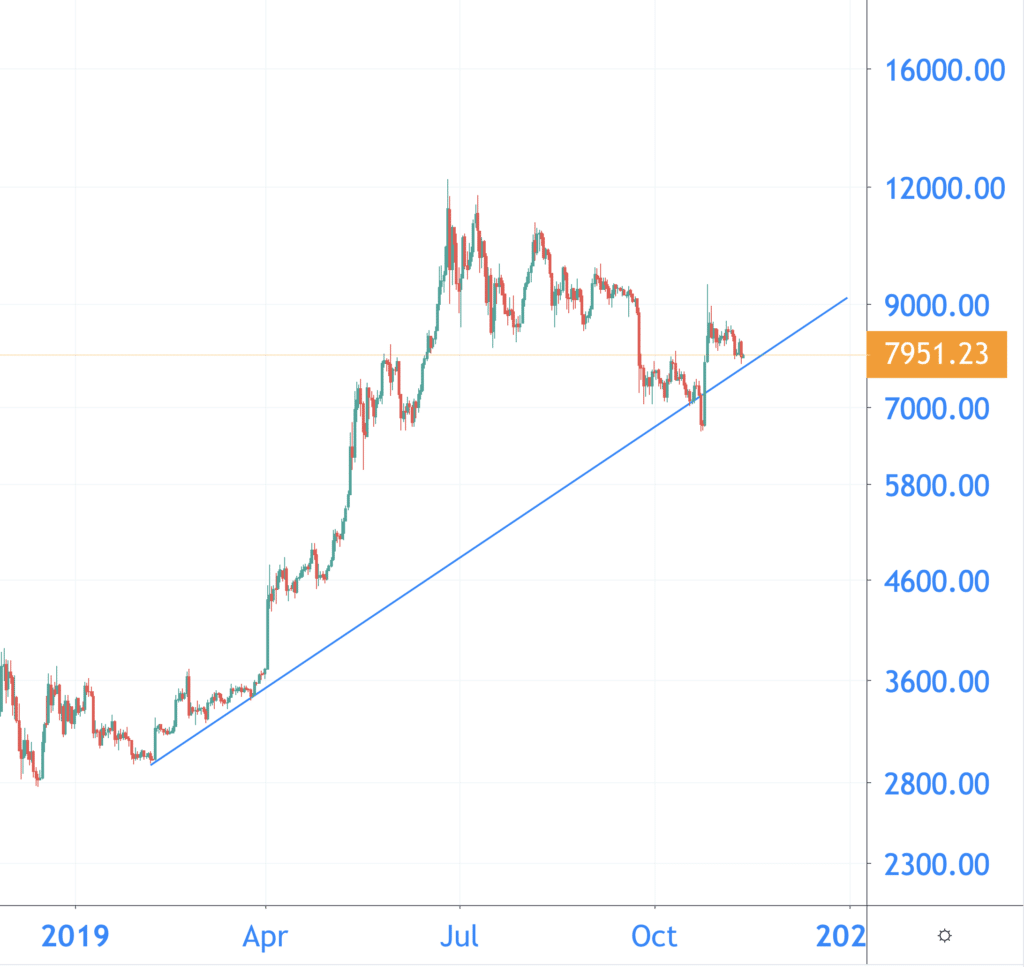
If you look at the rate from April 2019, you will see many small red candles and a few large green candles.
Each candle above represents one day. Many candles are red and if you follow the course every day you may feel that the course is not going well. Try to zoom out at such moments. A supporting trend line will be visible from the beginning of 2019. The course went into hiding only once, before it with all the violence of the world (read: since 2011 not grown so fast in one day) came out again.
The rate of bitcoin must be a few days in the year in which you see huge green candles. Fundstrat analyst Thomas Lee calculated that if you do not include the ten best days of bitcoin per year, the rate drops by 25% annually. By trading and investing on average at a fixed moment, you will not miss those few days.
Mayer multiple for the long term
The Mayer Multiple indicator is very interesting for the somewhat longer term. The Mayer Multiple indicator was designed by bitcoin investor Trace Mayer.

What does the Mayer Multiple say again? The Mayer Multiple shows the relationship between the Moving Average (MA) and the price. The price of bitcoin is divided by the value of the average of 200 days.
Is the Mayer Multiple lower than 1? Then the rate is below the 200-day MA (the green line). If the value is higher than 1, the rate is above the MA.
This indicator provides a lot of valuable information. Where are the tops and bottoms of the price in the longer term? The Mayer Multiple is visible in the graph above as a light blue line. In July the value rose above 2. This may be a sign that the price is being overvalued. Since then the course has dropped again and the Mayer Multiple has even dropped below 1.
According to RSI price rise in the short term
As you may have noticed, we are positive about the price developments in the long term. But we have also found a positive indicator for the shorter term.

Each candle stands for one hour. Although the course sometimes sinks and slightly lower bottoms are visible, the RSI shows a different story. It makes even higher bottoms, as we see in the purple part of the graph. This is called divergence. That is perhaps most obvious when we look at the two blue lines. They move towards each other. This often shows that the sales pressure is decreasing and that we can expect a price increase in the short term.
We can only be positive about the long-term course, and we adjust our investment strategy accordingly. In practice, this means investing periodically and sticking to your bitcoin to grab the best days.
Disclaimer: this is not buying advice. Think carefully about your strategy.
Related posts:
 Why do cryptocurrency Exist – Institutions
  Bitcoin and independent property rights
  NASDAQ on market manipulation: Everyone is now talking about regulating bitcoin and cryptocurrency
  Pilot Porsche on Ethereum blockchain to trace provenance materials
  Xfers from Singapore is going to use blockchain Zilliqa
  Make your own tokens with the Guarda wallet


