The first step is obviously to access this tool. To do this, simply click on the Start button and type "Resource Monitor" (not to be confused with performance monitor).
How to use the resource monitor
When you open the tool, a window appears that shows us general information about the CPU, disk, network and RAM. On the right we have graphs that show us statistics on the use of these four parameters at the last minute.
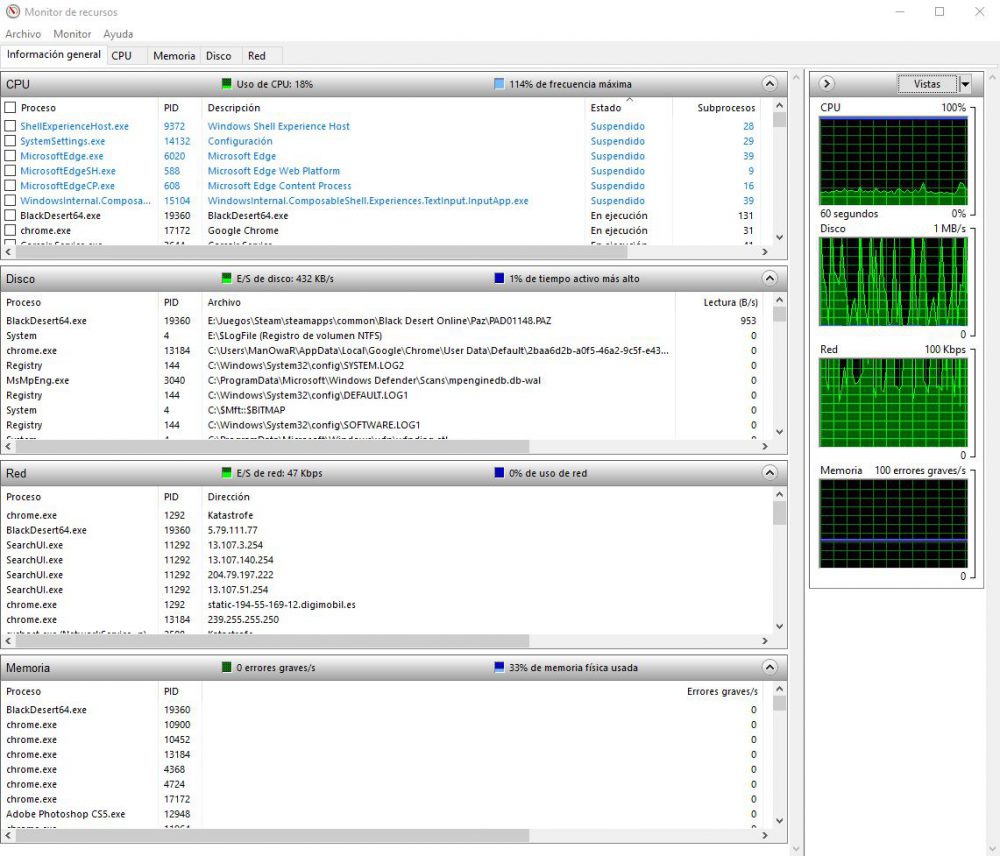
In this first screen we can already see very interesting information, but we will explain it better by focusing on each of the four parameters because everything here appears a little mixed and can be messy.
Therefore, we will go with these parameters one by one and start with the CPU tab.
CPU tab
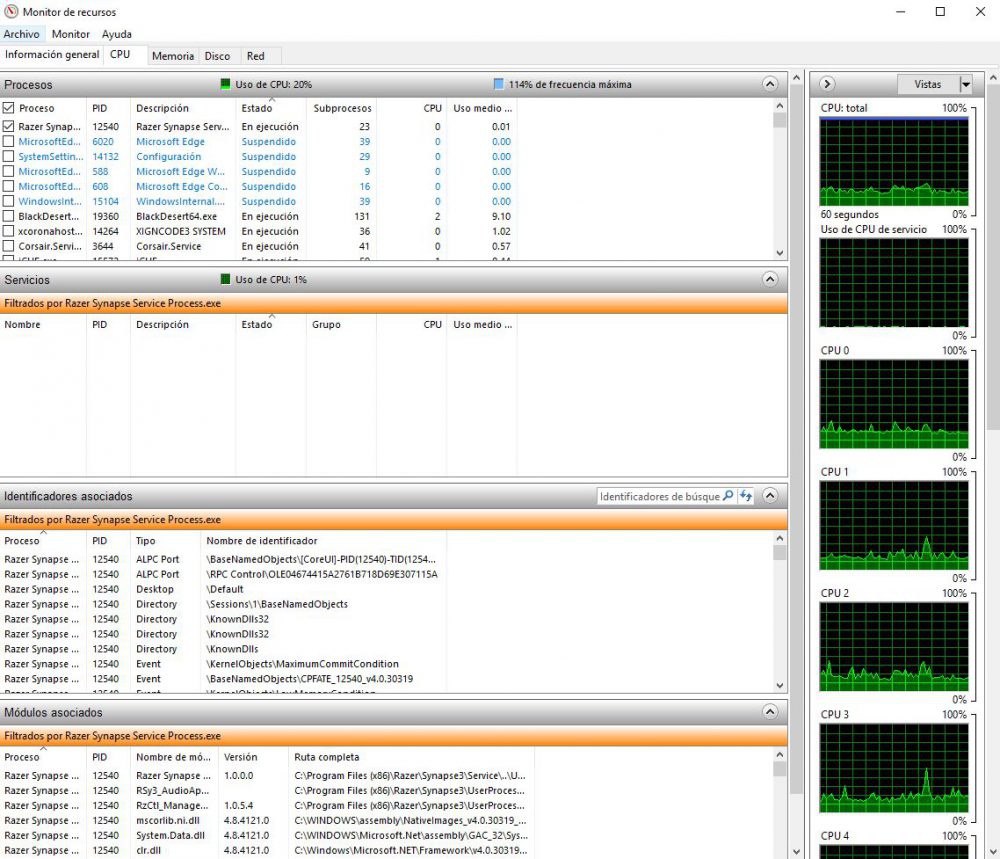
Here we find again some graphics on the right side, but this time they indicate the use of each of the processor cores individually, with the total in the first one.
In the "Processes" section we have all the active processes, with their description, the number of threads They depend on it, CPU usage and average usage. The interesting thing here is that if we select any of the processes (in our example we have selected the Razer Synapse process) it will filter through it in the lower sections, indicating the services in use, identifiers and associated modules.
What is this for? This can help us identify which applications depend on a main application, if it has associated services, and which executables it is using, including libraries (DLL) which you use and their version. In the event that we have a problem or error on the PC, this section of the resource monitor is ideal to be able to identify it and solve it.
Memory tab
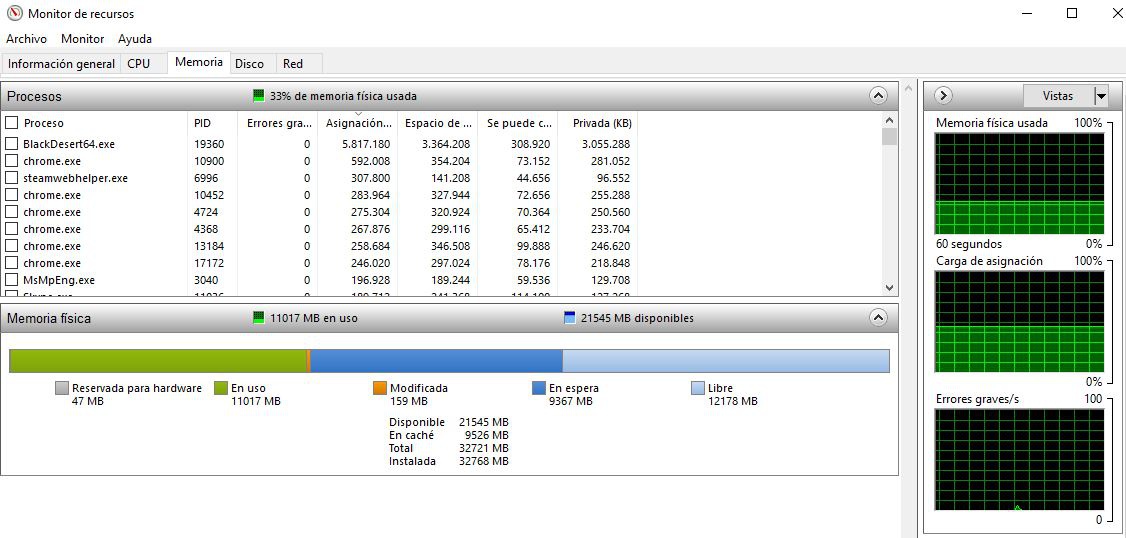
On the right we have some graphics that show us the use of memory, the allocation of the memory and if there are errors. On the left side we have the processes, with the amount of memory allocated (used or not), and below a detailed graph of what RAM is being used.
This section is ideal if your system consumes too much RAM and you do not know what it is being used for, helping you identify possible “greedy” programs that consume more RAM than they should.
Disc tab
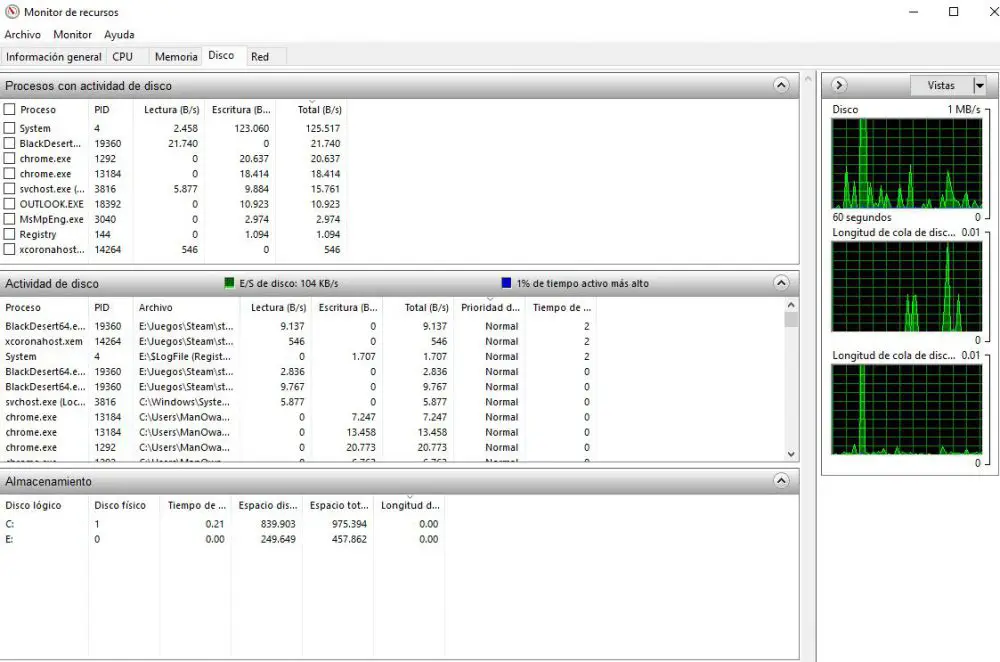
Here we see on the right the average use of the disk at the last minute, and below the tail of all the disks or SSD that you have installed. On the left, again we have all the active processes, but now what they show us are their reading and writing statistics. Below we have the activity of the disk, and finally the available and total capacity of the disks that we have installed.
Of course, filtering by process is also allowed here, and we can see how much disk activity a particular process is consuming.
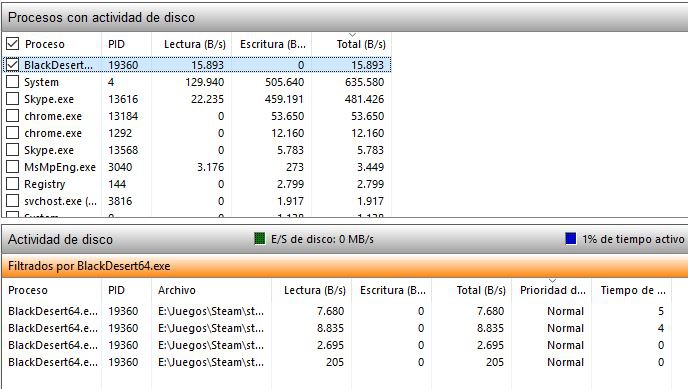
This can be very helpful if we notice that the performance of the disk or SSD is low, to determine if there is any program or service that is consuming its resources and causing everything else to go too slow.
Red tab
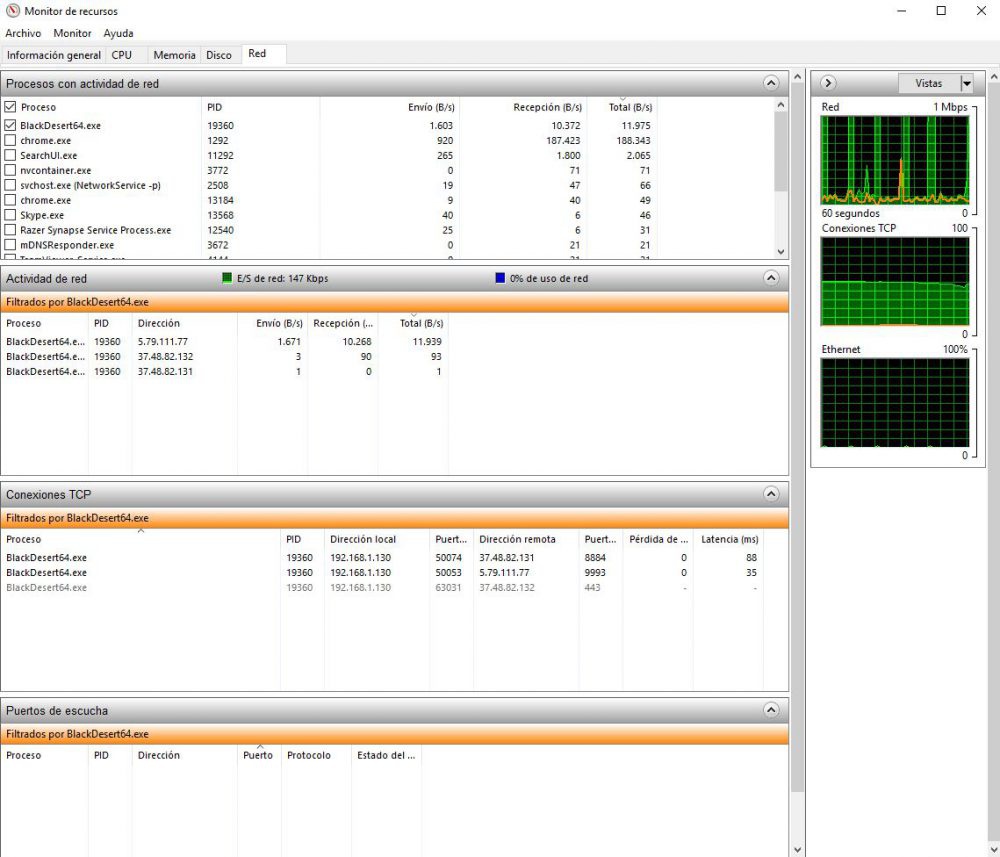
Here we find again on the right side some graphics, which in this case show us the use of the network and the number of TCP connections. This section is very interesting because it will allow us to see the network resources that are being consumed, and as we can filter, we can also see the IP of the servers to which we are connecting (including games) and the ports to which we make.
Related posts:
 7-nanometer Nvidia GPU, TSMC will handle most of the production
  ASRock X299, a new BIOS allows you to install 2 TB of memory
  MSI Prestige X570 Creation Review: Test | Specs | Hashrate
  Radeon RX 5500 XT, PCI Express 3.0 castrates performance?
  An overclocker ran 1TB of RAM on an X299 motherboard limited to 256GB
  Best Review 2021: MSI MPG X570 Gaming Edge WiFi Under $250 ($200)