


MSI Afterburner how to enable in-game FPS monitoring: FPS counter too fast – MSI Afterburner is a well-known utility for managing the parameters of AMD and Nvidia graphics accelerators. Doesn’t support Intel graphics cards. In addition to overclocking, downvolting and fan speed control, the program offers powerful tools for monitoring the technical performance of a graphics accelerator, memory, and central processor. This article will explain in detail how to enable and configure monitoring in MSI Afterburner.
How to enable monitoring in MSI Afterburner
Observation tools are represented by graphs in the corresponding panel and overlay (overlay) screen display (OSD). The second function is partly supported by default, partly requires the presence of the RivaTuner Statistics Server (RTSS) component . Without it, for example, in MSI Afterburner you can not see the FPS. It is installed after installing the program, you can also separately download and deploy the RivaTuner statistics server on your computer.
An overlay display is a modal image located on top of the main one – the game. The overlay and the background image are processed and displayed as separate layers, they do not affect each other.
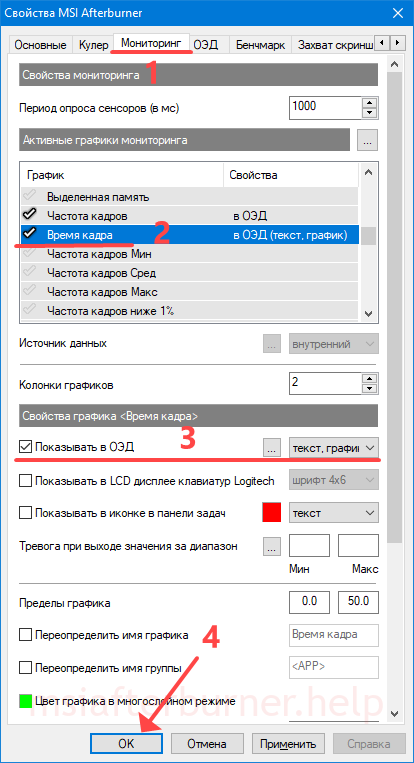
- Open the Afterburner settings, visit the “Monitoring” tab.
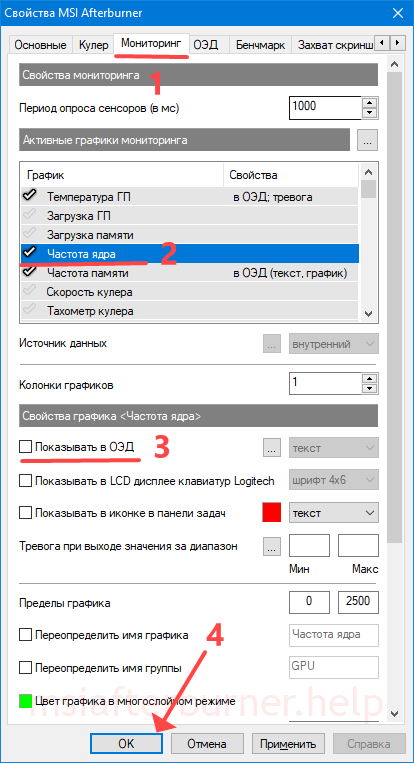
- In the “Active graphs …” section of the “Monitoring” tab, check the boxes: “GPU temperature”, “Frame rate” and other indicators.
- Click on each and turn on the “Show in OED” function. Display options in overlay.
To the right of the “Show in OED” option, the colors of the inscriptions, the methods for displaying indicators (text form, graphic, and both) change.
How to Set Up MSI Afterburner Monitoring
The application allows you to customize the appearance of the EOS in the “Monitoring” tab.
- Sensor polling period – the frequency of obtaining information from the sensors in milliseconds – respectively, and the frequency of updating information on the display.
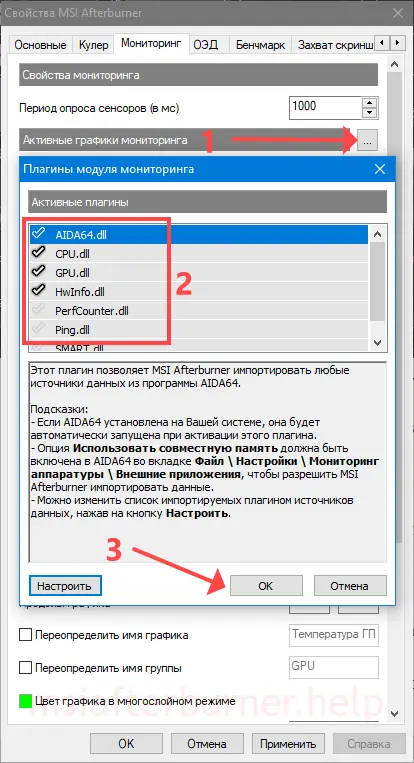
- Click on the button with three dots to the right of the name of the subsection “Active graphics …”. A list of plug-ins will open – they import additional parameters from other information and diagnostic utilities. Check the boxes next to the add-ons you want. Information will appear after launching the relevant programs: AIDA64, CPU-Z, GPU-Z.
- Check the box to display the graph in the monitoring window (pinned at the bottom of the program).
- Data source – where does MSI Afterburner get the data for plotting (internal or external – plugins).
- Chart properties – displayed at the bottom, active after selecting a chart (clicking on it). More about settings.
- The number of columns with graphs. Two columns of charts.
- Below are the properties of the current chart (which is under the cursor).
Graph Properties
- Display on the on-screen overlay display indicating the color of the element and how the parameter is displayed.
- Output information to the display built into the Logitech keyboard.
- Adding an icon to the tray, choosing its color, visualization method.
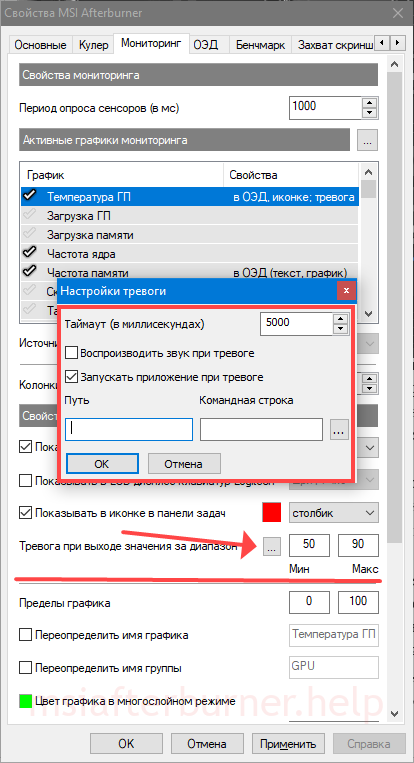
- Alarm when the value goes beyond the specified range – a yellow triangle will appear in the monitoring window with information that the indicator has gone beyond the specified range.
To notify the user, MSI Afterburner can launch applications, such as a music player, can automatically end the game, turn off the computer, play a sound file.
How to enable FPS in MSI Afterburner
It is important for gamers to see not only the temperature, loading and frequencies of computer components during gaming press, but also to monitor the FPS. This is the most important indicator for comfortable gameplay. The more FPS the video card generates, the smoother and more pleasant the picture.
To enable FPS display over games:
- Visit the “Monitoring” tab in the program settings.
- Activate the “Frame rate” option – check the box in front of the name.
- Change the values of the remaining parameters for yourself (described above) and save the configuration.
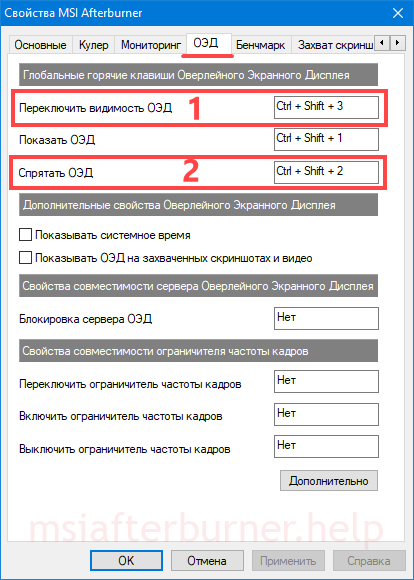
Configuring Hotkeys for EOS in MSI Afterburner
Activated the on-screen display in the overlay – it appeared. How can I disable this EOD? Hot keys.
- Open MSI Afterburner settings and visit the EOS tab.
- Click on the “Show EOD” field and hold down the key combination to enable the overlay with Alt, Ctrl or Shift, which is not used in Windows and other applications.
- Repeat the same to disable monitoring. Assigning keyboard shortcuts to control the overlay.
- Save your settings.
Programming buttons to display and disable EOS in games is not necessary, but soon after using the function, assigning operations to a global key combination will be required.
Important. The first line “Toggle EOS visibility” replaces the next two. One click will disable monitoring in MSI Afterburner (if enabled), and display if disabled.
Enabling Overlay in MSI Afterburner (OED)
To visualize and disable the selected indicators over the game, hold down the previously programmed buttons.
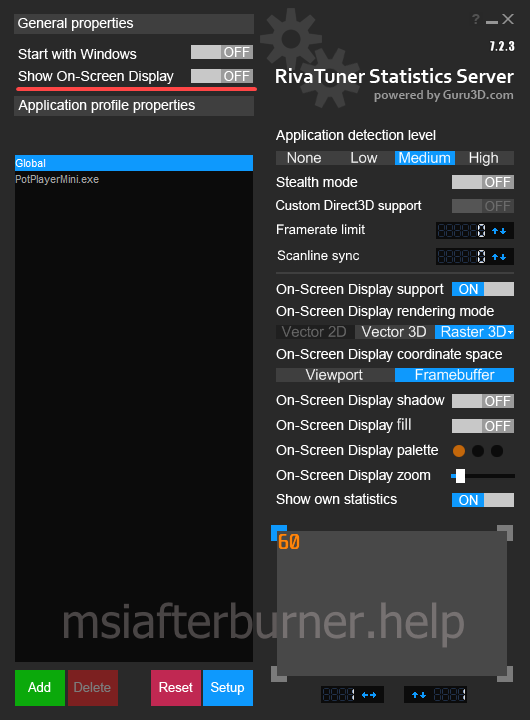
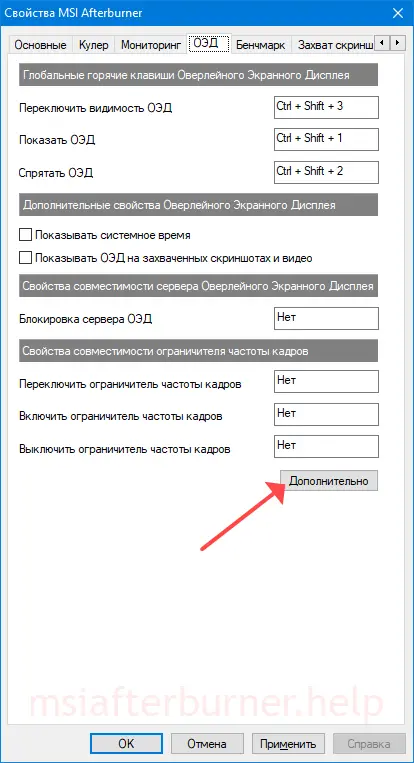
- If nothing appears, or MSI Afterburner stopped showing monitoring in games, click “Advanced …” in the “OED” tab to call the statistics server. Opens a window with additional options.
- Activate the “Show On-Screen Display” option.
- Then enable “On-Screen Display Support”. Overlay configuration.
The overlay appearance is configured in the window: color, font, size, shadow, display mode.
If the OED does not appear:
- Close the game and start RivaTuner Statistics Server.
- Click Add, select the game executable, click Open.
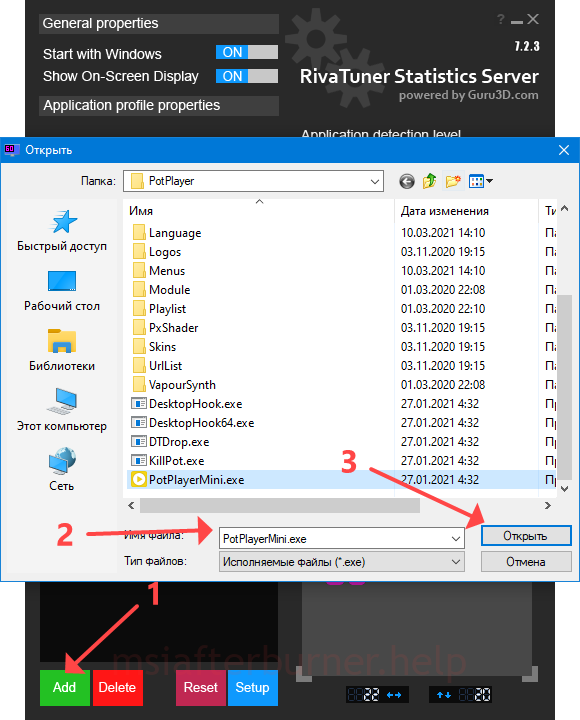
For each game, you can change the appearance of the OED.
How to enable Frametime graph in monitoring?
FPS is the frame rate displayed per second. Frametime – distribution of these frames in time. Out of 30 FPS, 10 frames can be generated in the first half second, and 20 FPS in the second. The uniformity of draw intervals is important for gamers. In cases of greater skew, microfreezes appear, jamming is noticeable.
In the summer of 2017, MSI Afterburner 4.4.0 was released with a new function to display Frametime or Frame Time on the chart.
Enable frametime in MSI Afterburner in the settings:
- Click on the gear, activate the “Monitoring” tab.
- Among the graphs, activate “Frame Time” – check the box in front of the name.
- Click on the name of the option, then – “Show in OED”.
- Select the visualization method “Graph” or “Text, Graph”.
- Apply settings. Frame time display activation algorithm.
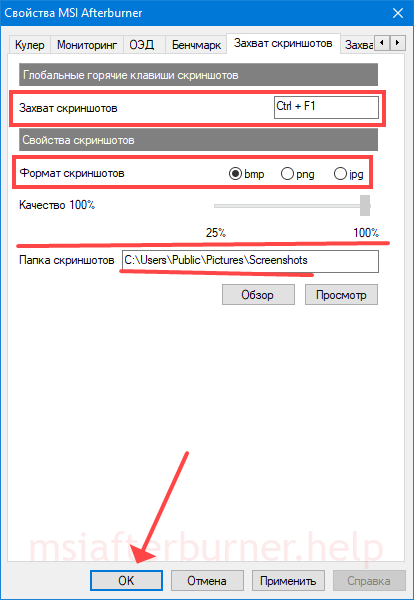
Configuring Game Screenshots and Video Capture
The screenshot and video capture features of MSI Afterburner are rarely used. First you need to set the keys to take screenshots, start and stop recording screen video.
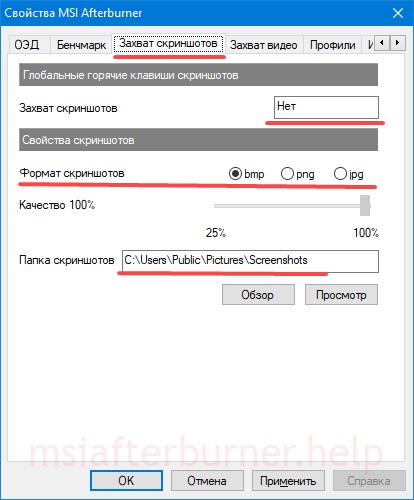
- In the settings, click on the text field and hold down the keys to take a screenshot.
- Select the format (optimally jpg) and image quality.
- Directory for saving graphic files. Configuring Screenshots in MSI Afterburner.
- Save your settings.
During the game, press the indicated button or combination to take screenshots.
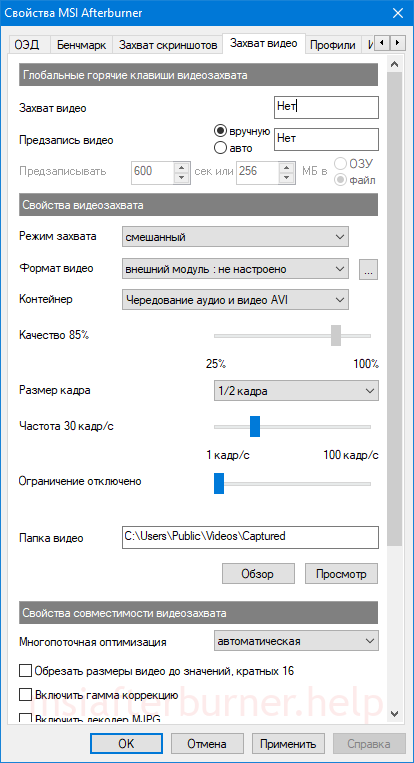
Setting up game video recording
- Visit the Video Capture tab.
- Click on the first text field and set a key or combination to record a game video. Video capture options.
- Specify other recording parameters: mode – desktop or 3D application (game), video format, container, quality, frame rate, output directory, and others.
How to use monitoring in games
To prevent overheating, be sure to turn on the alarm when the temperature sensor reaches 80-85°C. In order not to miss the moment of overheating, activate the sound function as a warning.
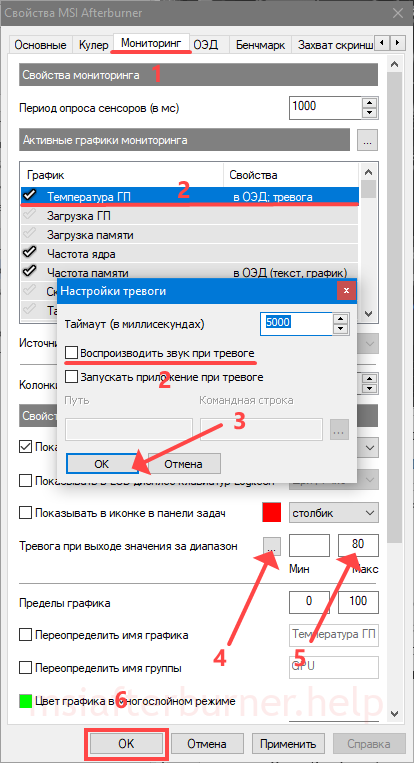
In addition to temperature, pay attention to FPS – drops below 24 frames will lead to jerky playback of the image. The situation is possible if the graphics accelerator can not cope with the load, with a strong heating of the video card. In the latter case, it resets the frequencies for cooling. When the device regularly or quickly heats up over 80-85 ° C, games crash, it is worth considering lowering the operating frequencies by a few percent. If you increased the voltage of the video core, reset it.
It happens that MSI Afterburner stops displaying EOS in Counter-Strike: Global Offensive (CS: GO). It helps to launch the game through the launcher with the “-allow_third_party_software” parameters. Try updating Afterburner. Read more about solving problems with monitoring at the link.
How to disable monitoring in Afterburner
- The display of unnecessary indicators is disabled in the monitoring settings: click on the parameter, uncheck “Show in OED” and apply the changes. Algorithm for disabling one or more indicators.
- All parameters will be removed from the screen by a combination of hot keys specified in the OED tab. The first combination alternately shows and hides, the third only hides.
The second option to turn off monitoring
Move the RTSS “Show On-Screen Display” switch to the “OFF” position.
Questions and answers
We will help you solve any problem with Afterburner.
Is it possible to adjust the monitoring position on the game screen?
Launch RTSS, select a profile (global or a specific game), on the screen at the bottom right, place the element in the right place with the mouse. Use the arrow buttons to precisely position the overlay. The “On-Screen Display zoom” switch changes the scale of the overlay.
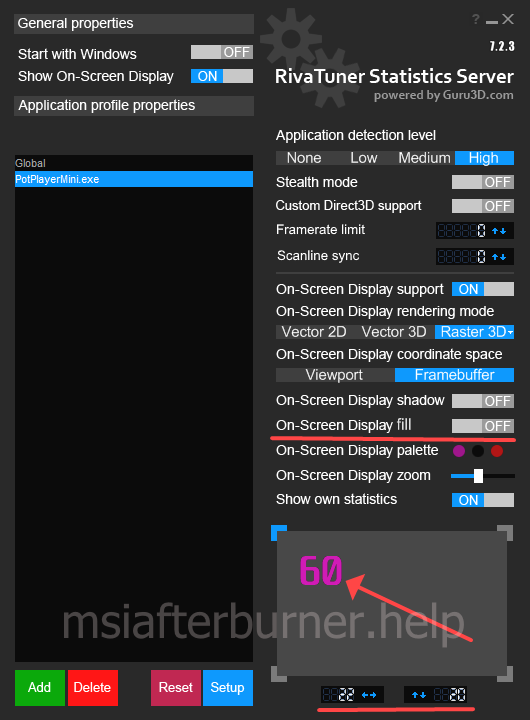
How to remove a darkened background that overlaps the same picture?
In RTSS, background filling with color is disabled by the “On-Screen Display fill” option (see screenshot above).
We respond promptly to questions regarding overclocking of video memory and graphics core and monitoring. We move them from the comments to the section above.
MSI Afterburner how to enable in-game FPS monitoring – MSI Afterburner is a well-known utility for managing the parameters of AMD and Nvidia graphics accelerators. Doesn’t support Intel graphics cards. In addition to overclocking, downvolting and fan speed control, the program offers powerful tools for monitoring the technical performance of a graphics accelerator, memory, and central processor. This article will explain in detail how to enable and configure monitoring in MSI Afterburner.
How to enable monitoring in MSI Afterburner
Observation tools are represented by graphs in the corresponding panel and overlay (overlay) screen display (OSD). The second function is partly supported by default, partly requires the presence of the RivaTuner Statistics Server (RTSS) component . Without it, for example, in MSI Afterburner you can not see the FPS. It is installed after installing the program, you can also separately download and deploy the RivaTuner statistics server on your computer.
An overlay display is a modal image located on top of the main one – the game. The overlay and the background image are processed and displayed as separate layers, they do not affect each other.
- Open the Afterburner settings, visit the “Monitoring” tab.
- In the “Active graphs …” section of the “Monitoring” tab, check the boxes: “GPU temperature”, “Frame rate” and other indicators.
- Click on each and turn on the “Show in OED” function. Display options in overlay.
To the right of the “Show in OED” option, the colors of the inscriptions, the methods for displaying indicators (text form, graphic, and both) change.
How to Set Up MSI Afterburner Monitoring
The application allows you to customize the appearance of the EOS in the “Monitoring” tab.
- Sensor polling period – the frequency of obtaining information from the sensors in milliseconds – respectively, and the frequency of updating information on the display.
- Click on the button with three dots to the right of the name of the subsection “Active graphics …”. A list of plug-ins will open – they import additional parameters from other information and diagnostic utilities. Check the boxes next to the add-ons you want. Information will appear after launching the relevant programs: AIDA64, CPU-Z, GPU-Z.
- Check the box to display the graph in the monitoring window (pinned at the bottom of the program).
- Data source – where does MSI Afterburner get the data for plotting (internal or external – plugins).
- Chart properties – displayed at the bottom, active after selecting a chart (clicking on it). More about settings.
- The number of columns with graphs. Two columns of charts.
- Below are the properties of the current chart (which is under the cursor).
Graph Properties
- Display on the on-screen overlay display indicating the color of the element and how the parameter is displayed.
- Output information to the display built into the Logitech keyboard.
- Adding an icon to the tray, choosing its color, visualization method.
- Alarm when the value goes beyond the specified range – a yellow triangle will appear in the monitoring window with information that the indicator has gone beyond the specified range.
To notify the user, MSI Afterburner can launch applications, such as a music player, can automatically end the game, turn off the computer, play a sound file.
How to enable FPS in MSI Afterburner
It is important for gamers to see not only the temperature, loading and frequencies of computer components during gaming press, but also to monitor the FPS. This is the most important indicator for comfortable gameplay. The more FPS the video card generates, the smoother and more pleasant the picture.
To enable FPS display over games:
- Visit the “Monitoring” tab in the program settings.
- Activate the “Frame rate” option – check the box in front of the name.
- Change the values of the remaining parameters for yourself (described above) and save the configuration.
Configuring Hotkeys for EOS in MSI Afterburner
Activated the on-screen display in the overlay – it appeared. How can I disable this EOD? Hot keys.
- Open MSI Afterburner settings and visit the EOS tab.
- Click on the “Show EOD” field and hold down the key combination to enable the overlay with Alt, Ctrl or Shift, which is not used in Windows and other applications.
- Repeat the same to disable monitoring. Assigning keyboard shortcuts to control the overlay.
- Save your settings.
Programming buttons to display and disable EOS in games is not necessary, but soon after using the function, assigning operations to a global key combination will be required.
Important. The first line “Toggle EOS visibility” replaces the next two. One click will disable monitoring in MSI Afterburner (if enabled), and display if disabled.
Enabling Overlay in MSI Afterburner (OED)
To visualize and disable the selected indicators over the game, hold down the previously programmed buttons.
- If nothing appears, or MSI Afterburner stopped showing monitoring in games, click “Advanced …” in the “OED” tab to call the statistics server. Opens a window with additional options.
- Activate the “Show On-Screen Display” option.
- Then enable “On-Screen Display Support”. Overlay configuration.
The overlay appearance is configured in the window: color, font, size, shadow, display mode.
If the OED does not appear:
- Close the game and start RivaTuner Statistics Server.
- Click Add, select the game executable, click Open.
For each game, you can change the appearance of the OED.
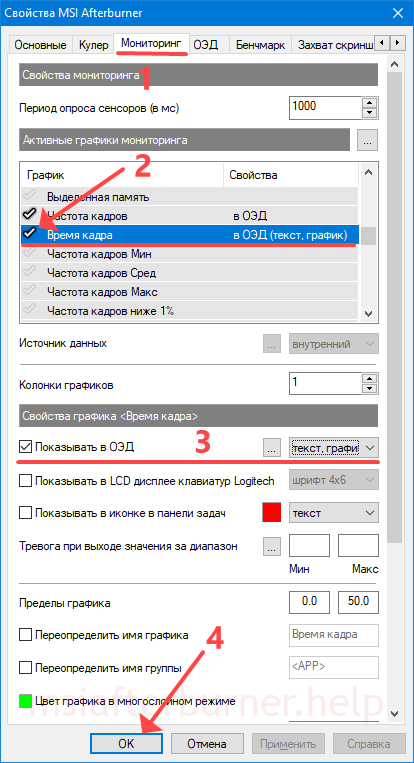
How to enable Frametime graph in monitoring?
FPS is the frame rate displayed per second. Frametime – distribution of these frames in time. Out of 30 FPS, 10 frames can be generated in the first half second, and 20 FPS in the second. The uniformity of draw intervals is important for gamers. In cases of greater skew, microfreezes appear, jamming is noticeable.
In the summer of 2017, MSI Afterburner 4.4.0 was released with a new function to display Frametime or Frame Time on the chart.
Enable frametime in MSI Afterburner in the settings:
- Click on the gear, activate the “Monitoring” tab.
- Among the graphs, activate “Frame Time” – check the box in front of the name.
- Click on the name of the option, then – “Show in OED”.
- Select the visualization method “Graph” or “Text, Graph”.
- Apply settings. Frame time display activation algorithm.
Configuring Game Screenshots and Video Capture
The screenshot and video capture features of MSI Afterburner are rarely used. First you need to set the keys to take screenshots, start and stop recording screen video.
- In the settings, click on the text field and hold down the keys to take a screenshot.
- Select the format (optimally jpg) and image quality.
- Directory for saving graphic files. Configuring Screenshots in MSI Afterburner.
- Save your settings.
During the game, press the indicated button or combination to take screenshots.
Setting up game video recording
- Visit the Video Capture tab.
- Click on the first text field and set a key or combination to record a game video. Video capture options.
- Specify other recording parameters: mode – desktop or 3D application (game), video format, container, quality, frame rate, output directory, and others.
How to use monitoring in games
To prevent overheating, be sure to turn on the alarm when the temperature sensor reaches 80-85°C. In order not to miss the moment of overheating, activate the sound function as a warning.
In addition to temperature, pay attention to FPS – drops below 24 frames will lead to jerky playback of the image. The situation is possible if the graphics accelerator can not cope with the load, with a strong heating of the video card. In the latter case, it resets the frequencies for cooling. When the device regularly or quickly heats up over 80-85 ° C, games crash, it is worth considering lowering the operating frequencies by a few percent. If you increased the voltage of the video core, reset it.
It happens that MSI Afterburner stops displaying EOS in Counter-Strike: Global Offensive (CS: GO). It helps to launch the game through the launcher with the “-allow_third_party_software” parameters. Try updating Afterburner. Read more about solving problems with monitoring at the link.
How to disable monitoring in Afterburner
- The display of unnecessary indicators is disabled in the monitoring settings: click on the parameter, uncheck “Show in OED” and apply the changes. Algorithm for disabling one or more indicators.
- All parameters will be removed from the screen by a combination of hot keys specified in the OED tab. The first combination alternately shows and hides, the third only hides.
The second option to turn off monitoring
Move the RTSS “Show On-Screen Display” switch to the “OFF” position.
Questions and answers
We will help you solve any problem with Afterburner.
Is it possible to adjust the monitoring position on the game screen?
Launch RTSS, select a profile (global or a specific game), on the screen at the bottom right, place the element in the right place with the mouse. Use the arrow buttons to precisely position the overlay. The “On-Screen Display zoom” switch changes the scale of the overlay.
How to remove a darkened background that overlaps the same picture?
In RTSS, background filling with color is disabled by the “On-Screen Display fill” option (see screenshot above).
We respond promptly to questions regarding overclocking of video memory and graphics core and monitoring. We move them from the comments to the section above.
MSI Afterburner how to enable in-game FPS monitoring – MSI Afterburner is a well-known utility for managing the parameters of AMD and Nvidia graphics accelerators. Doesn’t support Intel graphics cards. In addition to overclocking, downvolting and fan speed control, the program offers powerful tools for monitoring the technical performance of a graphics accelerator, memory, and central processor. This article will explain in detail how to enable and configure monitoring in MSI Afterburner.
How to enable monitoring in MSI Afterburner
Observation tools are represented by graphs in the corresponding panel and overlay (overlay) screen display (OSD). The second function is partly supported by default, partly requires the presence of the RivaTuner Statistics Server (RTSS) component . Without it, for example, in MSI Afterburner you can not see the FPS. It is installed after installing the program, you can also separately download and deploy the RivaTuner statistics server on your computer.
An overlay display is a modal image located on top of the main one – the game. The overlay and the background image are processed and displayed as separate layers, they do not affect each other.
- Open the Afterburner settings, visit the “Monitoring” tab.
- In the “Active graphs …” section of the “Monitoring” tab, check the boxes: “GPU temperature”, “Frame rate” and other indicators.
- Click on each and turn on the “Show in OED” function. Display options in overlay.
To the right of the “Show in OED” option, the colors of the inscriptions, the methods for displaying indicators (text form, graphic, and both) change.
How to Set Up MSI Afterburner Monitoring
The application allows you to customize the appearance of the EOS in the “Monitoring” tab.
- Sensor polling period – the frequency of obtaining information from the sensors in milliseconds – respectively, and the frequency of updating information on the display.
- Click on the button with three dots to the right of the name of the subsection “Active graphics …”. A list of plug-ins will open – they import additional parameters from other information and diagnostic utilities. Check the boxes next to the add-ons you want. Information will appear after launching the relevant programs: AIDA64, CPU-Z, GPU-Z.
- Check the box to display the graph in the monitoring window (pinned at the bottom of the program).
- Data source – where does MSI Afterburner get the data for plotting (internal or external – plugins).
- Chart properties – displayed at the bottom, active after selecting a chart (clicking on it). More about settings.
- The number of columns with graphs. Two columns of charts.
- Below are the properties of the current chart (which is under the cursor).
Graph Properties
- Display on the on-screen overlay display indicating the color of the element and how the parameter is displayed.
- Output information to the display built into the Logitech keyboard.
- Adding an icon to the tray, choosing its color, visualization method.
- Alarm when the value goes beyond the specified range – a yellow triangle will appear in the monitoring window with information that the indicator has gone beyond the specified range.
To notify the user, MSI Afterburner can launch applications, such as a music player, can automatically end the game, turn off the computer, play a sound file.
How to enable FPS in MSI Afterburner
It is important for gamers to see not only the temperature, loading and frequencies of computer components during gaming press, but also to monitor the FPS. This is the most important indicator for comfortable gameplay. The more FPS the video card generates, the smoother and more pleasant the picture.
To enable FPS display over games:
- Visit the “Monitoring” tab in the program settings.
- Activate the “Frame rate” option – check the box in front of the name.
- Change the values of the remaining parameters for yourself (described above) and save the configuration.
Configuring Hotkeys for EOS in MSI Afterburner
Activated the on-screen display in the overlay – it appeared. How can I disable this EOD? Hot keys.
- Open MSI Afterburner settings and visit the EOS tab.
- Click on the “Show EOD” field and hold down the key combination to enable the overlay with Alt, Ctrl or Shift, which is not used in Windows and other applications.
- Repeat the same to disable monitoring. Assigning keyboard shortcuts to control the overlay.
- Save your settings.
Programming buttons to display and disable EOS in games is not necessary, but soon after using the function, assigning operations to a global key combination will be required.
Important. The first line “Toggle EOS visibility” replaces the next two. One click will disable monitoring in MSI Afterburner (if enabled), and display if disabled.
Enabling Overlay in MSI Afterburner (OED)
To visualize and disable the selected indicators over the game, hold down the previously programmed buttons.
- If nothing appears, or MSI Afterburner stopped showing monitoring in games, click “Advanced …” in the “OED” tab to call the statistics server. Opens a window with additional options.
- Activate the “Show On-Screen Display” option.
- Then enable “On-Screen Display Support”. Overlay configuration.
The overlay appearance is configured in the window: color, font, size, shadow, display mode.
If the OED does not appear:
- Close the game and start RivaTuner Statistics Server.
- Click Add, select the game executable, click Open.
For each game, you can change the appearance of the OED.
How to enable Frametime graph in monitoring?
FPS is the frame rate displayed per second. Frametime – distribution of these frames in time. Out of 30 FPS, 10 frames can be generated in the first half second, and 20 FPS in the second. The uniformity of draw intervals is important for gamers. In cases of greater skew, microfreezes appear, jamming is noticeable.
In the summer of 2017, MSI Afterburner 4.4.0 was released with a new function to display Frametime or Frame Time on the chart.
Enable frametime in MSI Afterburner in the settings:
- Click on the gear, activate the “Monitoring” tab.
- Among the graphs, activate “Frame Time” – check the box in front of the name.
- Click on the name of the option, then – “Show in OED”.
- Select the visualization method “Graph” or “Text, Graph”.
- Apply settings. Frame time display activation algorithm.
Configuring Game Screenshots and Video Capture
The screenshot and video capture features of MSI Afterburner are rarely used. First you need to set the keys to take screenshots, start and stop recording screen video.
- In the settings, click on the text field and hold down the keys to take a screenshot.
- Select the format (optimally jpg) and image quality.
- Directory for saving graphic files. Configuring Screenshots in MSI Afterburner.
- Save your settings.
During the game, press the indicated button or combination to take screenshots.
Setting up game video recording
- Visit the Video Capture tab.
- Click on the first text field and set a key or combination to record a game video. Video capture options.
- Specify other recording parameters: mode – desktop or 3D application (game), video format, container, quality, frame rate, output directory, and others.
How to use monitoring in games
To prevent overheating, be sure to turn on the alarm when the temperature sensor reaches 80-85°C. In order not to miss the moment of overheating, activate the sound function as a warning.
In addition to temperature, pay attention to FPS – drops below 24 frames will lead to jerky playback of the image. The situation is possible if the graphics accelerator can not cope with the load, with a strong heating of the video card. In the latter case, it resets the frequencies for cooling. When the device regularly or quickly heats up over 80-85 ° C, games crash, it is worth considering lowering the operating frequencies by a few percent. If you increased the voltage of the video core, reset it.
It happens that MSI Afterburner stops displaying EOS in Counter-Strike: Global Offensive (CS: GO). It helps to launch the game through the launcher with the “-allow_third_party_software” parameters. Try updating Afterburner.
How to disable monitoring in Afterburner
- The display of unnecessary indicators is disabled in the monitoring settings: click on the parameter, uncheck “Show in OED” and apply the changes. Algorithm for disabling one or more indicators.
- All parameters will be removed from the screen by a combination of hot keys specified in the OED tab. The first combination alternately shows and hides, the third only hides.
The second option to turn off monitoring
Move the RTSS “Show On-Screen Display” switch to the “OFF” position.
Questions and answers
We will help you solve any problem with Afterburner.
Is it possible to adjust the monitoring position on the game screen?
Launch RTSS, select a profile (global or a specific game), on the screen at the bottom right, place the element in the right place with the mouse. Use the arrow buttons to precisely position the overlay. The “On-Screen Display zoom” switch changes the scale of the overlay.
How to remove a darkened background that overlaps the same picture?
In RTSS, background filling with color is disabled by the “On-Screen Display fill” option (see screenshot above).
We respond promptly to questions regarding overclocking of video memory and graphics core and monitoring. We move them from the comments to the section above.
Related posts:
 Core Voltage MSI Afterburner: How to Unlock Core Voltage | Core 100 | Voltage slider
  Geforce RTX 2060 MSI Afterburner Settings: Best Recommendations: Memory clock/Type – GDDR6
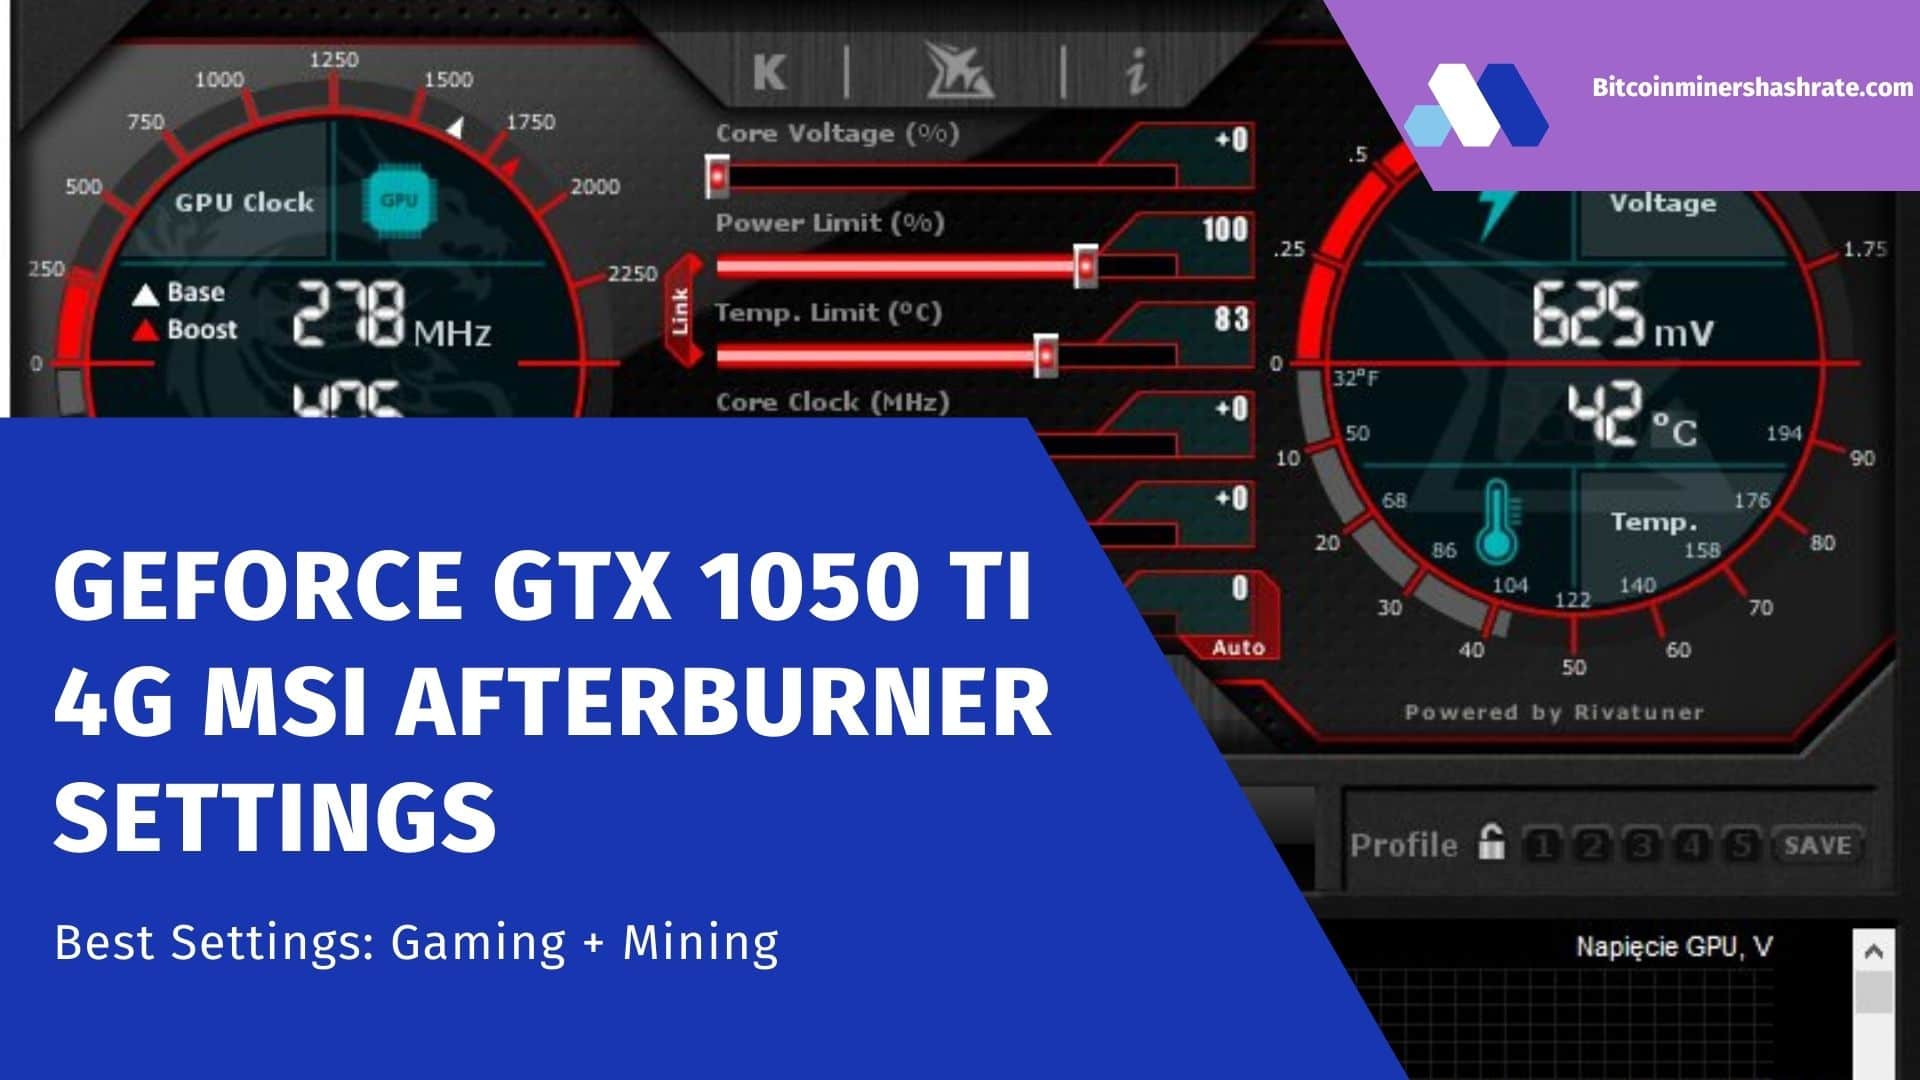
  Geforce GTX 1050 ti 4G MSI Afterburner Settings: Best Settings – Mining + Gaming (Tinny Shocked)
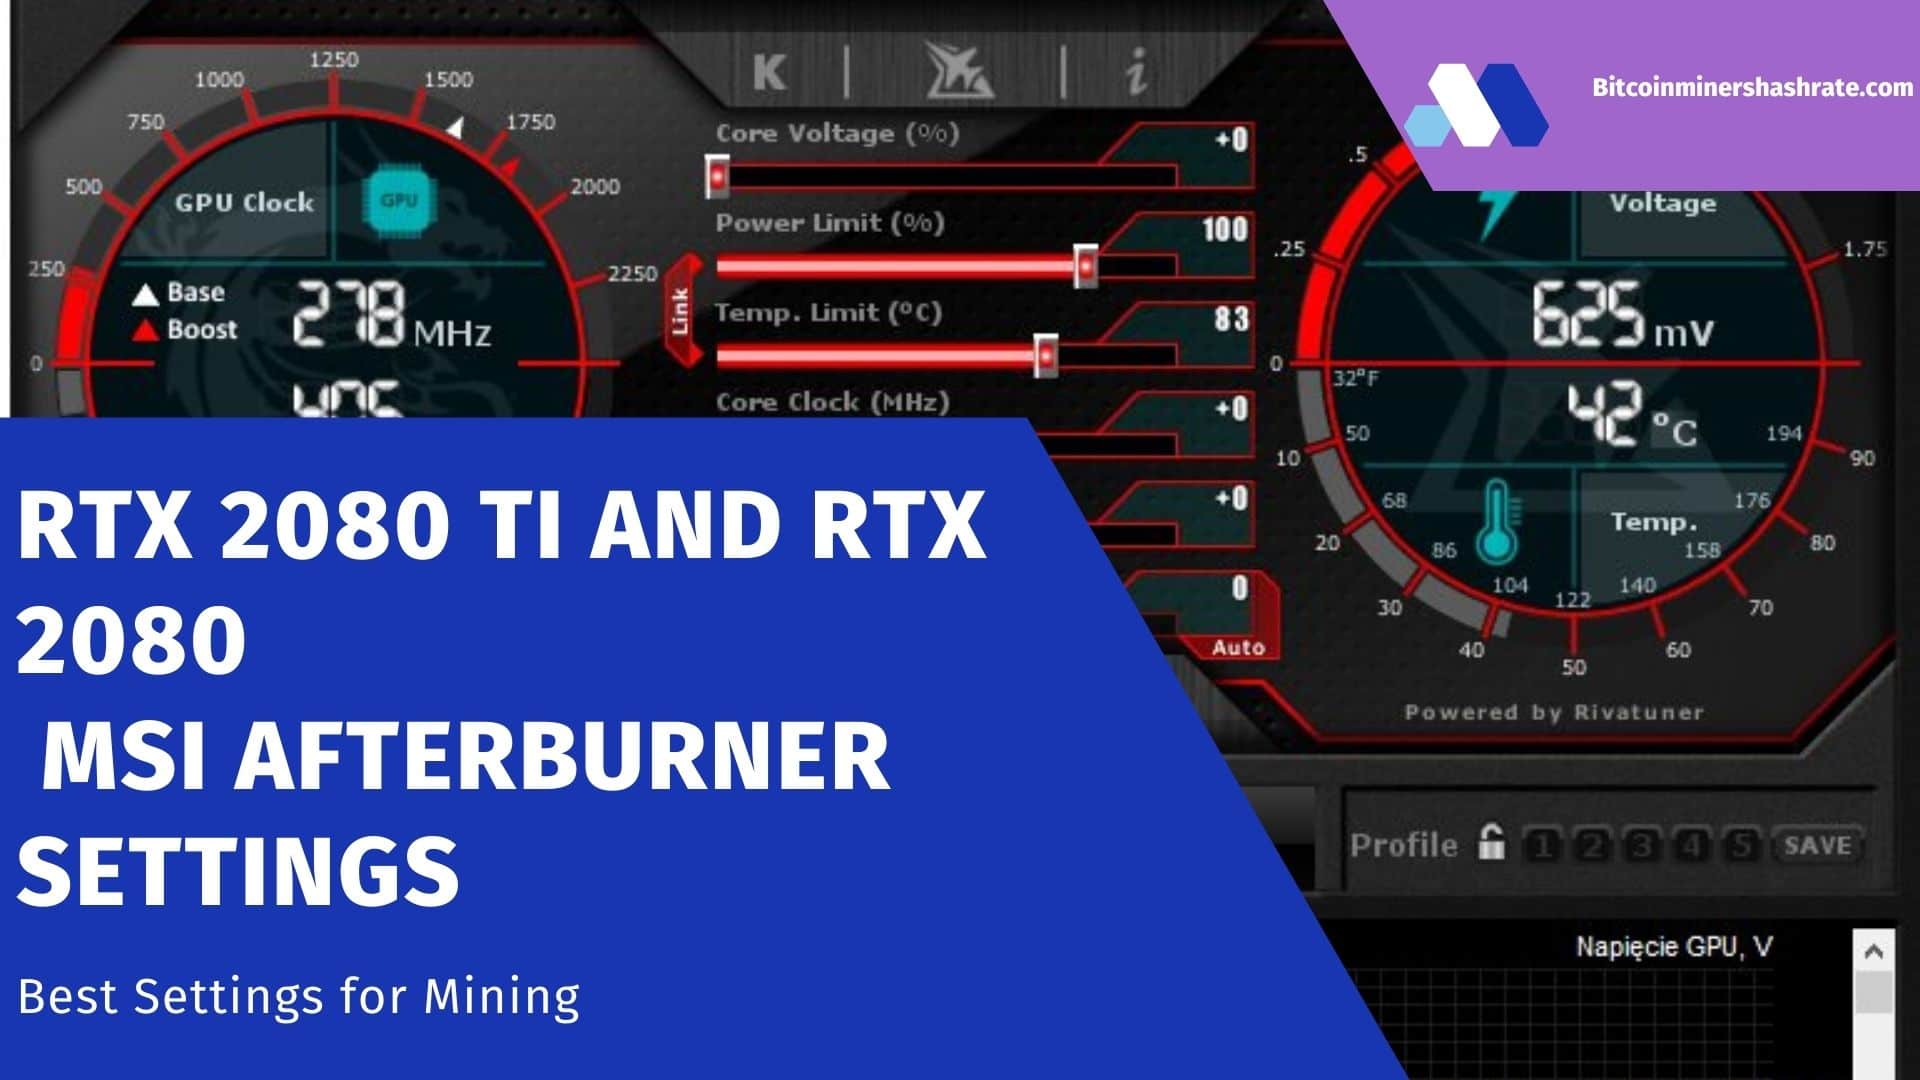
  RTX 2080 TI and RTX 2080 MSI Afterburner Settings: Best Overclocking Setup (2022)
  How to set up a graphics card cooler in MSI Afterburner: The Best Right Steps
  How to Increase Hashrate ATI Radeon HD 5850 Mining: Overlcocking | PC Assembly | Game
