


MSI Afterburner how to use: Setup instructions | What to do if won’t download or update? – MSI Afterburner utility is not only a tool for improving the performance of the computer’s graphics subsystem. Its arsenal is full of additional tools for video capture, monitoring, and they are expanded through plugins.
We will tell you how to use Afterburner: we will provide a general algorithm for overclocking video chips, we will describe the main functions and options of the application . We will show the monitoring capabilities, ways to personalize charts and control the speed of the video card fan. We will show how the afterburner hotkey control is configured.
MSI Afterburner how to use: About the program
A stable and reliable assistant for a gamer, overclocker, miner, capable of taking the performance of discrete graphics to a new level. Gives access to real-time performance monitoring of the graphics accelerator. Builds graphs of two dozen indicators, including temperature, frequencies, load on video card components .
The appearance of windows changes due to themes. The updated engine made it possible to reduce their size and speed up the drawing of the interface. RivaTuner Statistic Server (RTSS) will record the screen video to a file and display the frame rate (FPS) in the game. MSI Afterburner saves up to five overclocking profiles, supports hotkey control. Can automatically start with Windows. To autorun, click on the “Startup” icon. Program autorun button along with Windows.
MSI Afterburner Setup instructions: Dashboard
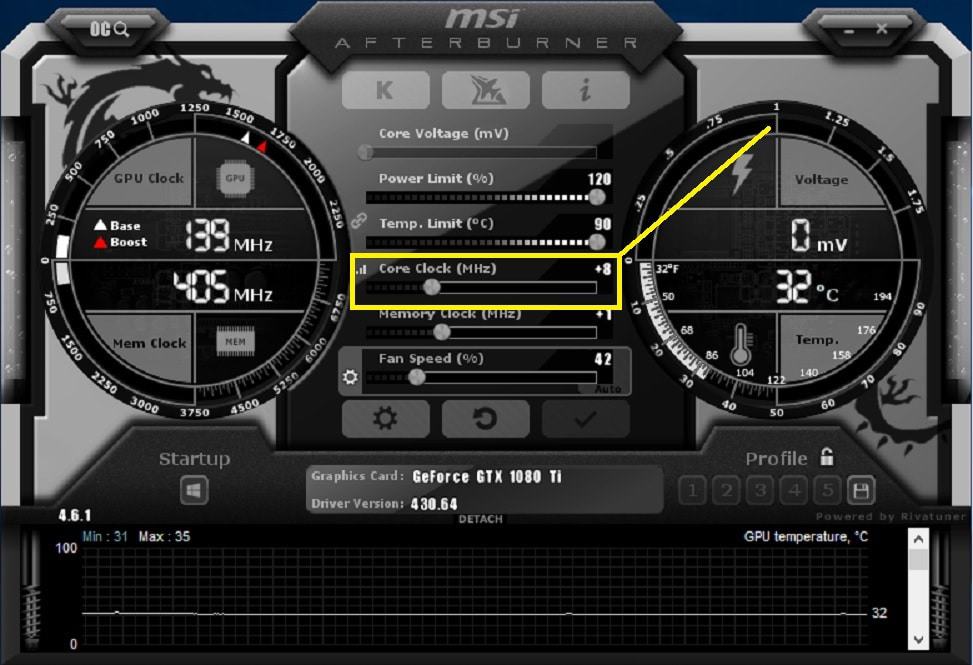
It is represented by two information elements with useful information about the operating modes of the hardware components of the graphics accelerator: core and video memory frequencies, voltage, thermal parameters, video core voltage.
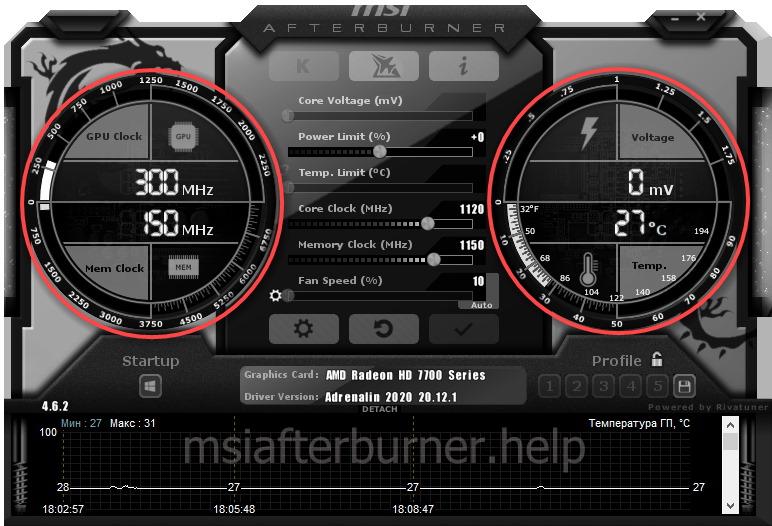
MSI Afterburner Setup instructions: Dashboard
Below is the “Monitoring Window” – a panel with time graphs of the characteristics of the video card: frame rate, computing elements, RAM and video memory usage, CPU and GPU, other (26 variables).
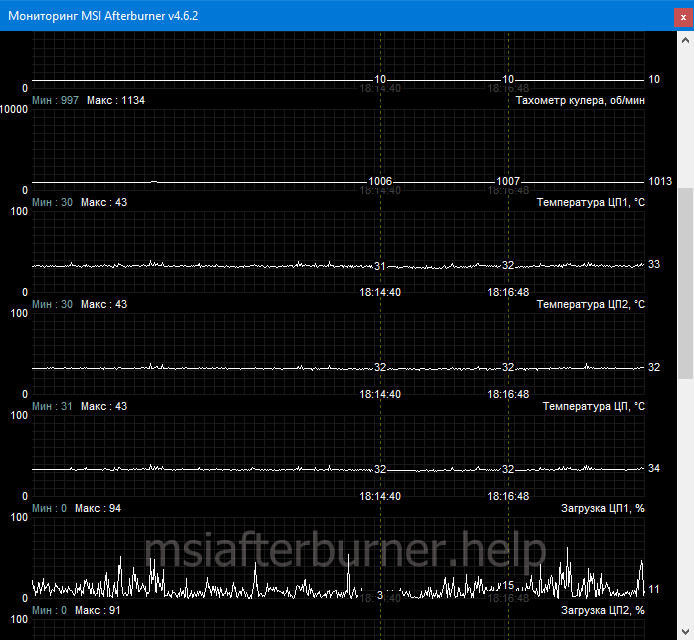
Panel with time graphs of video card characteristics
You can turn off unnecessary graphics, change the color of the curve and the name (caption), font, size for quick orientation. To expand the number of active monitoring charts, third-party plugins are connected (with AIDA64, HWiNFO). Afterburner provides for the installation of through markers (left click with the Alt button pressed) in the monitoring window.
Main parameters
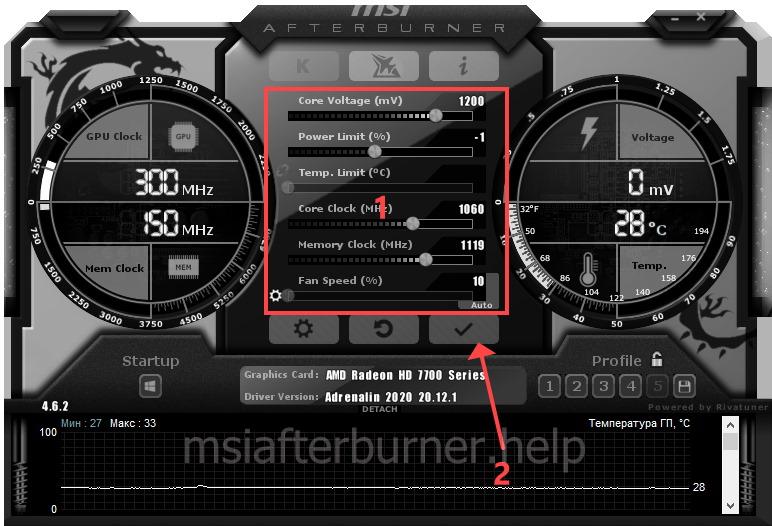
The purpose of MSI Afterburner is to overclock the graphics subsystem by increasing the base frequencies and voltage of its components. This is done in the main window by dragging the sliders. Options are available here:
| Core Voltage | The value of the supplied supply voltage to the card core |
| Power Limit | Limiting power consumption |
| Temp. Limit | Peak temperature, upon reaching which the program resets the settings |
| Core Clock | GPU frequency |
| Memory Clock | Graphics memory frequency |
| Fan Speed | Graphic card fan speed |
Some parameters may be inactive. To learn how to unlock controls in MSI Afterburner, such as Core Voltage , go to settings, enable “Unlock voltage control” in Afterburner, apply the settings and restart the application.
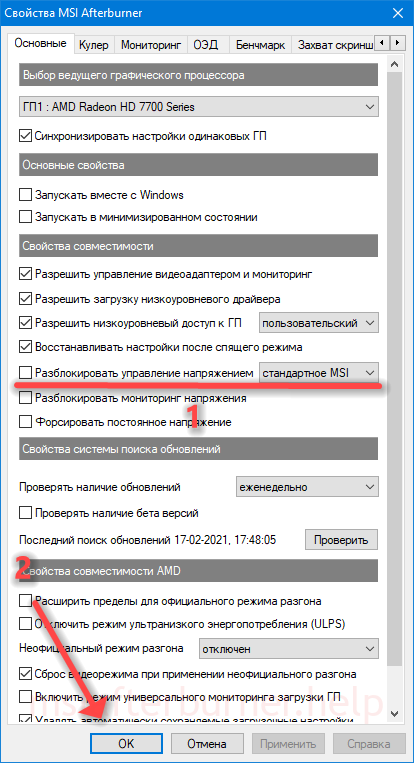
Important. Read more about how to unlock sliders in the publication.
MSI Afterburner settings
To open the settings, click on the gear icon or use the Ctrl + S combination.
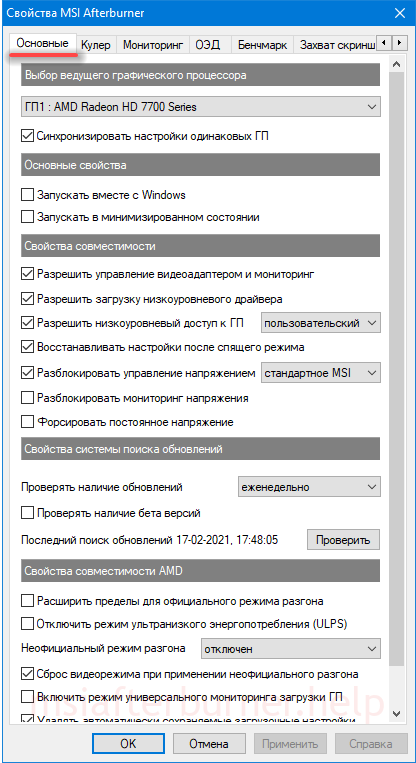
Main
A tab with general settings for the interface, Afterburner behavior and compatibility.
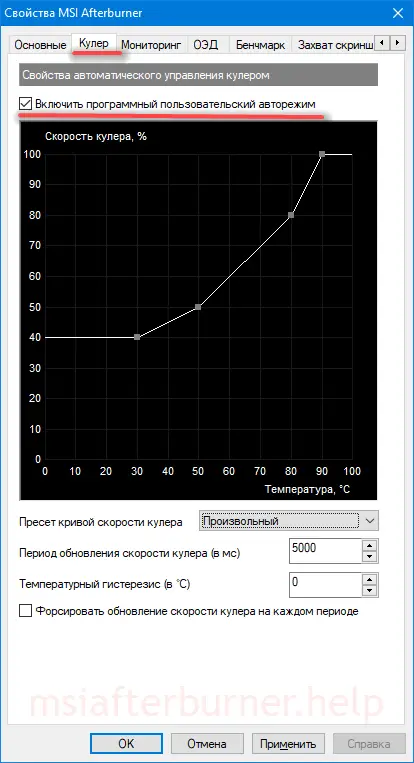
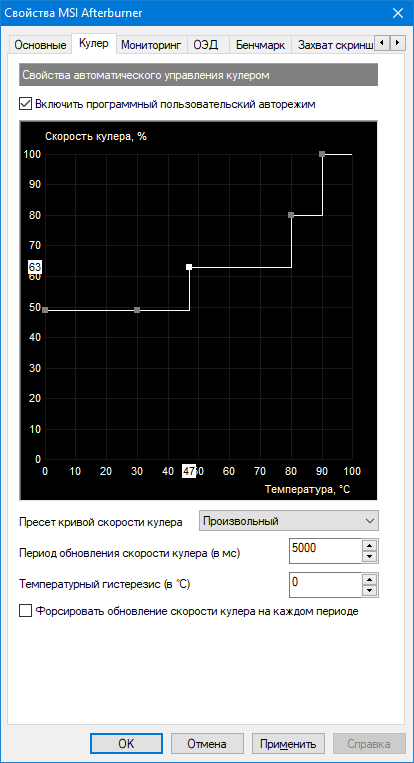
Cooler Settings
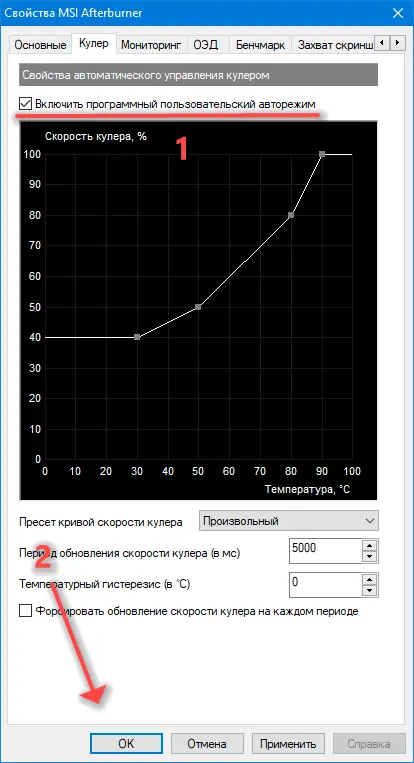
Parameters for automatic fan speed adjustment by changing the curve. The temperature of the graphics core is set horizontally, and the cooler frequency as a percentage of the peak is set vertically. This specifies the period for updating the rotation speed (default is 5 seconds).
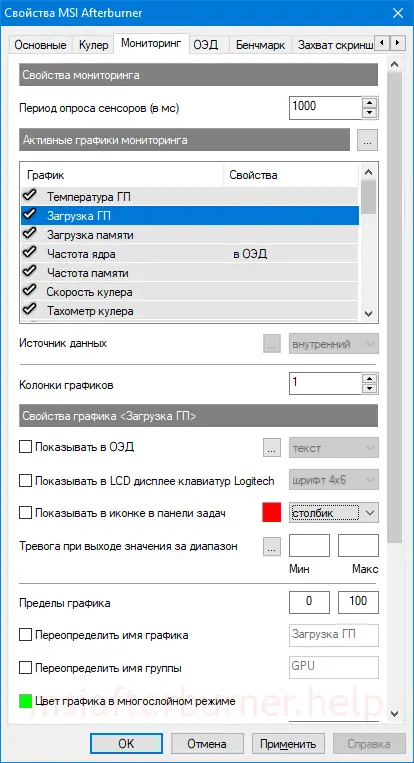
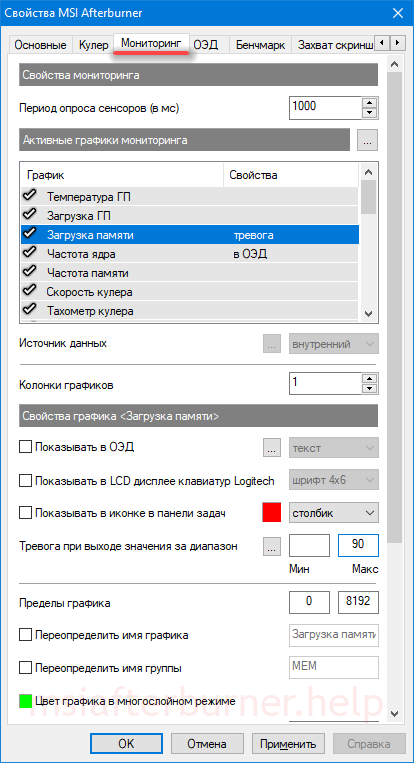
Setting Monitoring Options in MSI Afterburner
Enable/disable graphs on the dashboard by clicking on the checkmark next to their name, customize their appearance, set limit values. Limits are set here: minimum and maximum values (for example, temperatures). When the parameters for which the alarm is triggered are exited, a warning window will appear.
Read more about working with the monitoring tool in the publication at the link .
OED – overlay screen display
Information panel with information about the frame rate in games. These are frequencies, temperature, workload (RAM and graphics memory, central and video cores).
Important. Overlay doesn’t work without RTSS.
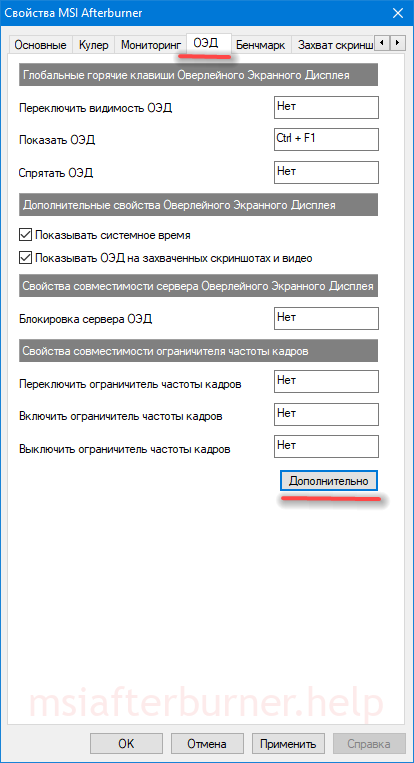
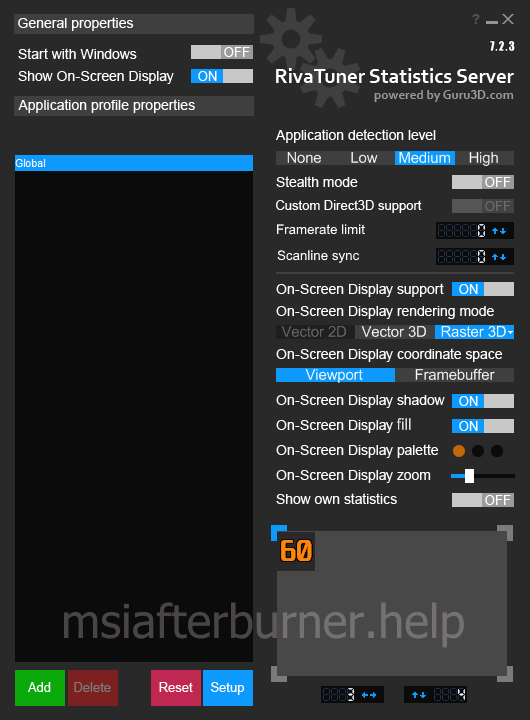
The “Advanced” button will open the RivaTuner Statistic Server settings – a window with overlay options. Only if RTSS is installed.
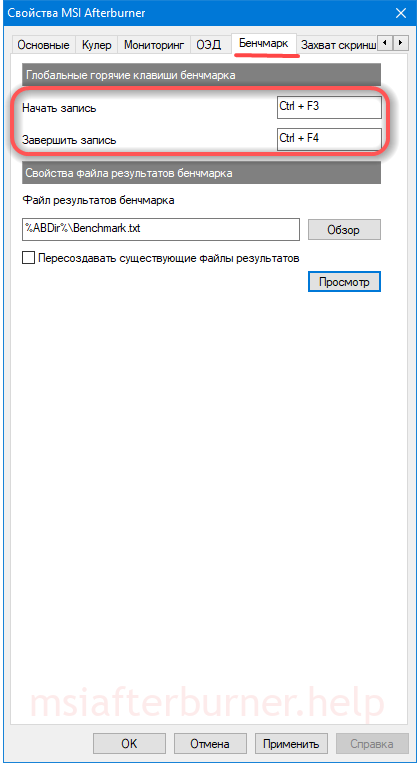
Benchmark settings
Key programming for starting and stopping the built-in benchmark, viewing test results, transferring a directory to store them.
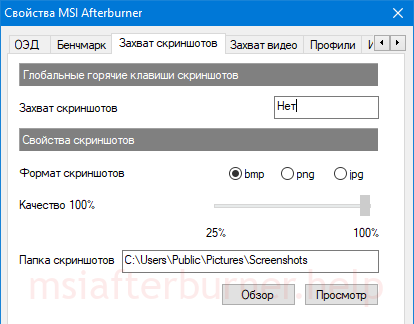
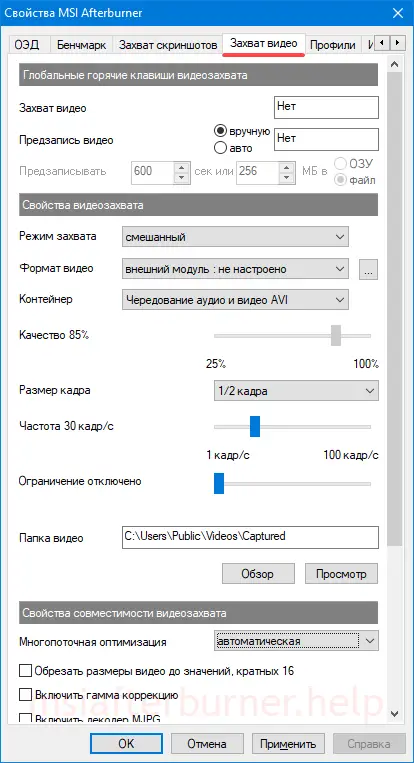
Screenshot capture , video recording
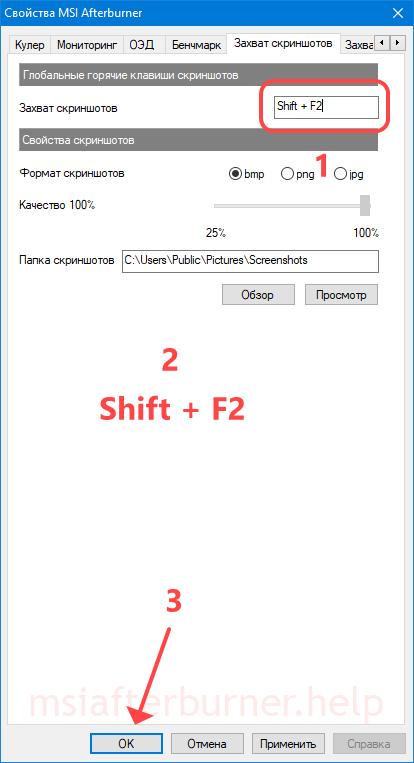
The first tab contains options for creating screenshots in 2D and 3D applications: save path, format, quality, hotkeys for triggering the shutter release.
In the next tab, configure the video capture settings. It changes the keys to start and stop recording, indicate the characteristics of the video file: resolution, method (desktop, 3D), video format, container used to store it, frame rate. Below select the audio source – Afterburner writes only one audio track.
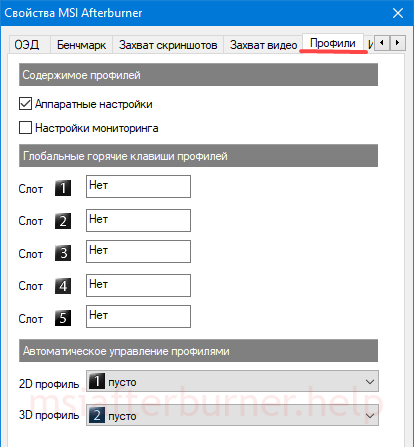
Overclocking Save Profiles
Adjusting the content of cells with templates – overclocking settings, of which there are five in Afterburner. To activate each preset, you can set a global key combination, bind a profile slot with a video card operating mode: 2D or 3D.
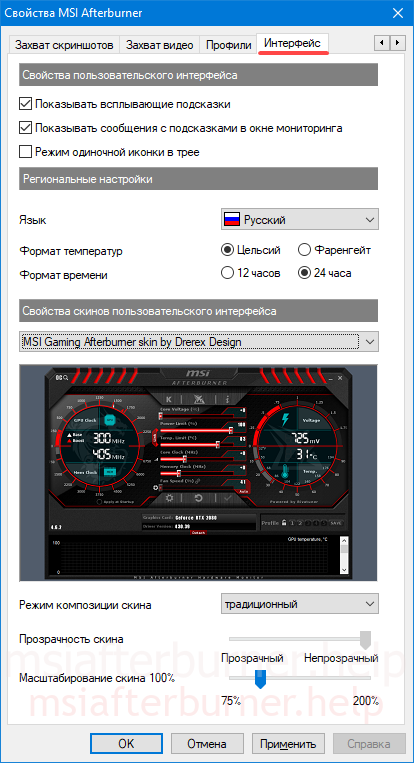
Interface settings
In the section, disable pop-up hints, change the localization language, the temperature unit, and the time display format. Below they change the themes themselves (skins), the transparency level of the Afterburner window.
Saving Afterburner settings by profile
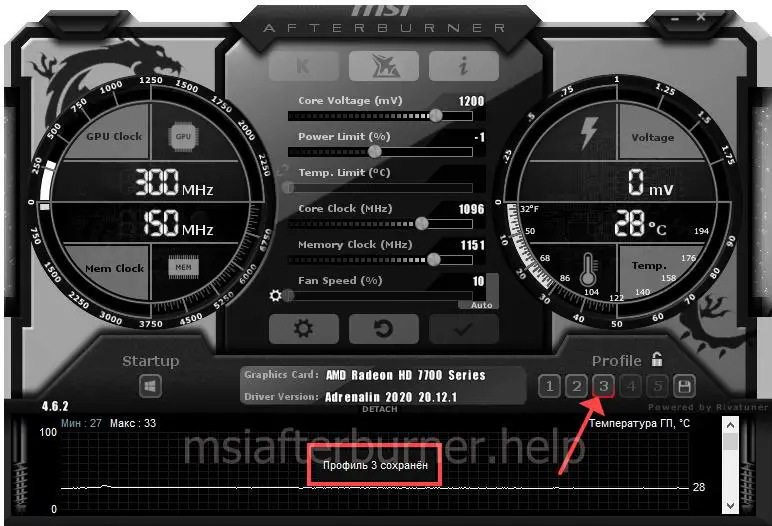
The application can store up to five profiles with different overclocking settings and fan settings (from the General Settings section):
Attention. To enable editing profiles, click on the button with the lock icon above the cells.
- Overclock the video card – unlock and drag the sliders to the desired positions.
- Apply the new configuration.
- Right click on the icon to save the settings to the cell. Saving overclocking settings.
- It will be highlighted in red, and a corresponding notification will appear in the dashboard.
- Activate live settings with left click, clear cells with right click.
How to enable fan control
- If the Fan Speed slider is not active, click on the gear icon or hold Ctrl + S in the “Cooler” tab, check the only option and save the changes. Enable software user auto mode.
- As a result, a graph will appear where you can set the fan speed depending on the performance of the temperature sensor of the graphics core. The shape of the curve determines the cooling efficiency and noise of the video card.
- To make the curve rectangular, double-click on the graph with the left mouse button.
How to overclock a video card?
Overclockers, subject to close monitoring and the availability of a high-quality cooling system, will be able to squeeze out the potential of the device from the manufacturer. The overclocking algorithm depends on the model of the graphics accelerator and the version of the driver used . In general, you can increase the frequency of the memory, the core of the video card, the value of the supply voltage of the video core, the power consumption.
Read more about overclocking in the article.
Hotkeys
By default, most actions are not assigned to keyboard shortcuts. Bind hotkeys to actions in settings:
- Click on the empty cell “No”.
- Hold down a free combination of buttons on the keyboard (not system ones, not used in other programs to avoid conflicts).
- Apply changes.
Among the system hot keys:
| Ctrl + S | Opens settings |
| Ctrl + M | Calling the dashboard |
| Ctrl + L | Prohibit and enable modification of profiles |
| Ctrl + I | Displaying system information |
Questions and answers
Where can I find the cpu temperature setting?
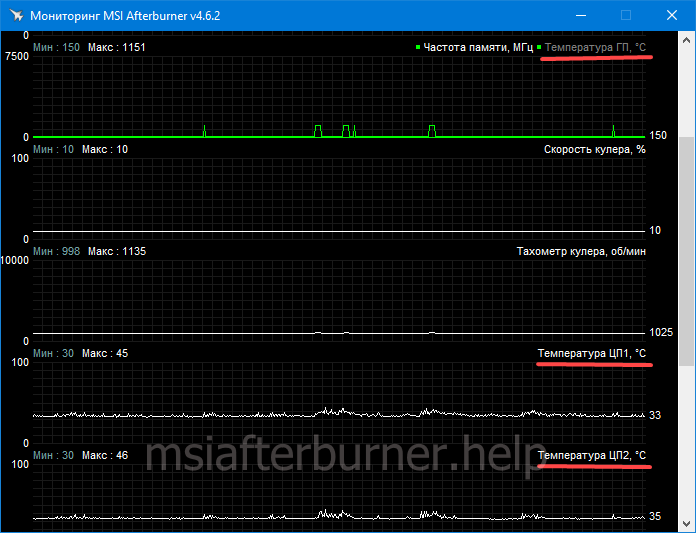
Afterburner displays data from GPU and CPU thermal sensors. To view the current value, double-click on the monitoring panel at the bottom of the window or hold down Ctrl + M. The “GPU temperature” of the graphics core is displayed in the first lines, to view the heating intensity of the CPU cores (a separate graph for each), scroll down the list.
How to display data/statistics on the screen?
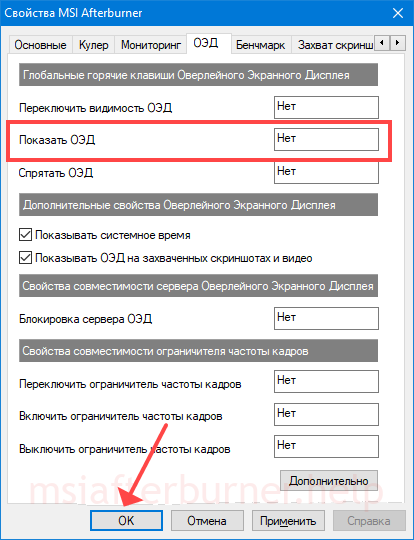
Open the settings, in the “OED” tab, click on the “Show” OED “field, assign hotkeys and apply the settings.
Switch to the game and hold down the indicated keys.
If something does not work out or you doubt some action – ask. The instruction consists of answers to questions from our visitors.
Related posts:
 Core Voltage MSI Afterburner: How to Unlock Core Voltage | Core 100 | Voltage slider
  Geforce RTX 2060 MSI Afterburner Settings: Best Recommendations: Memory clock/Type – GDDR6
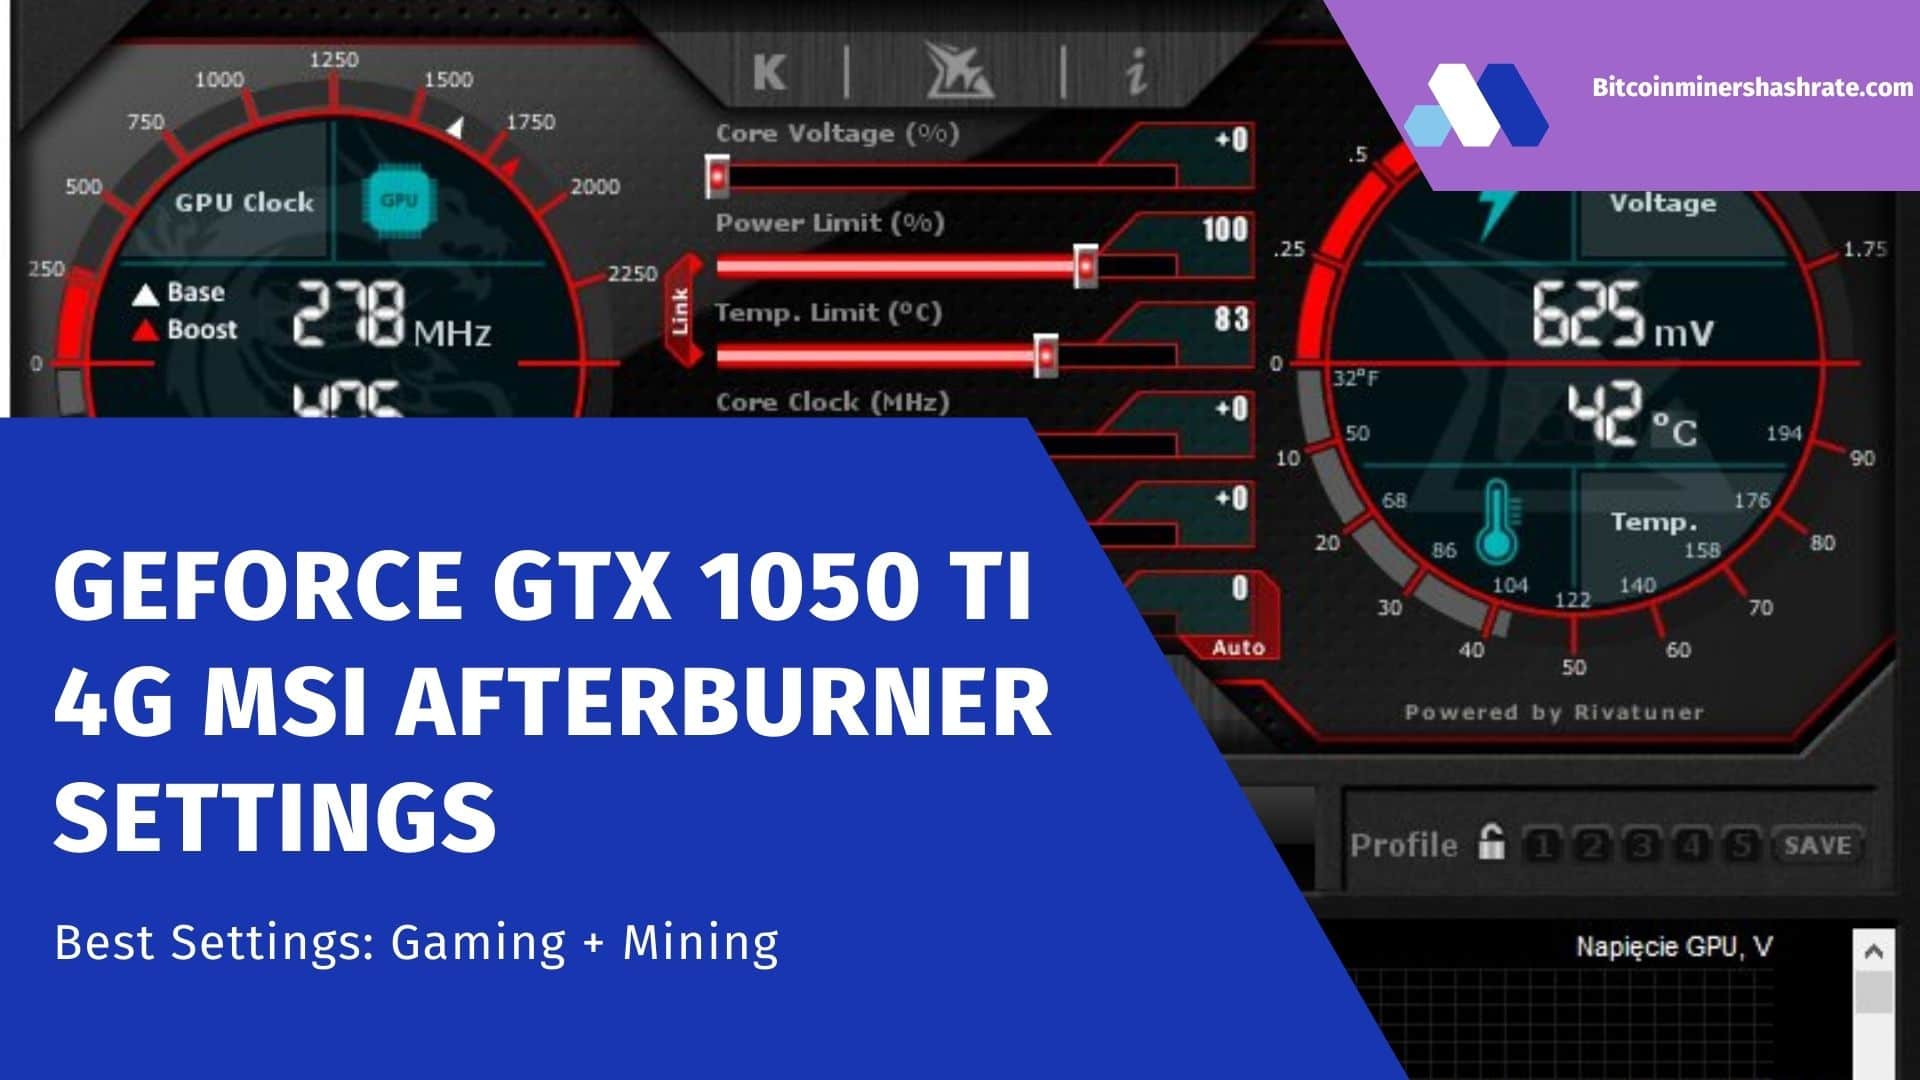
  Geforce GTX 1050 ti 4G MSI Afterburner Settings: Best Settings – Mining + Gaming (Tinny Shocked)
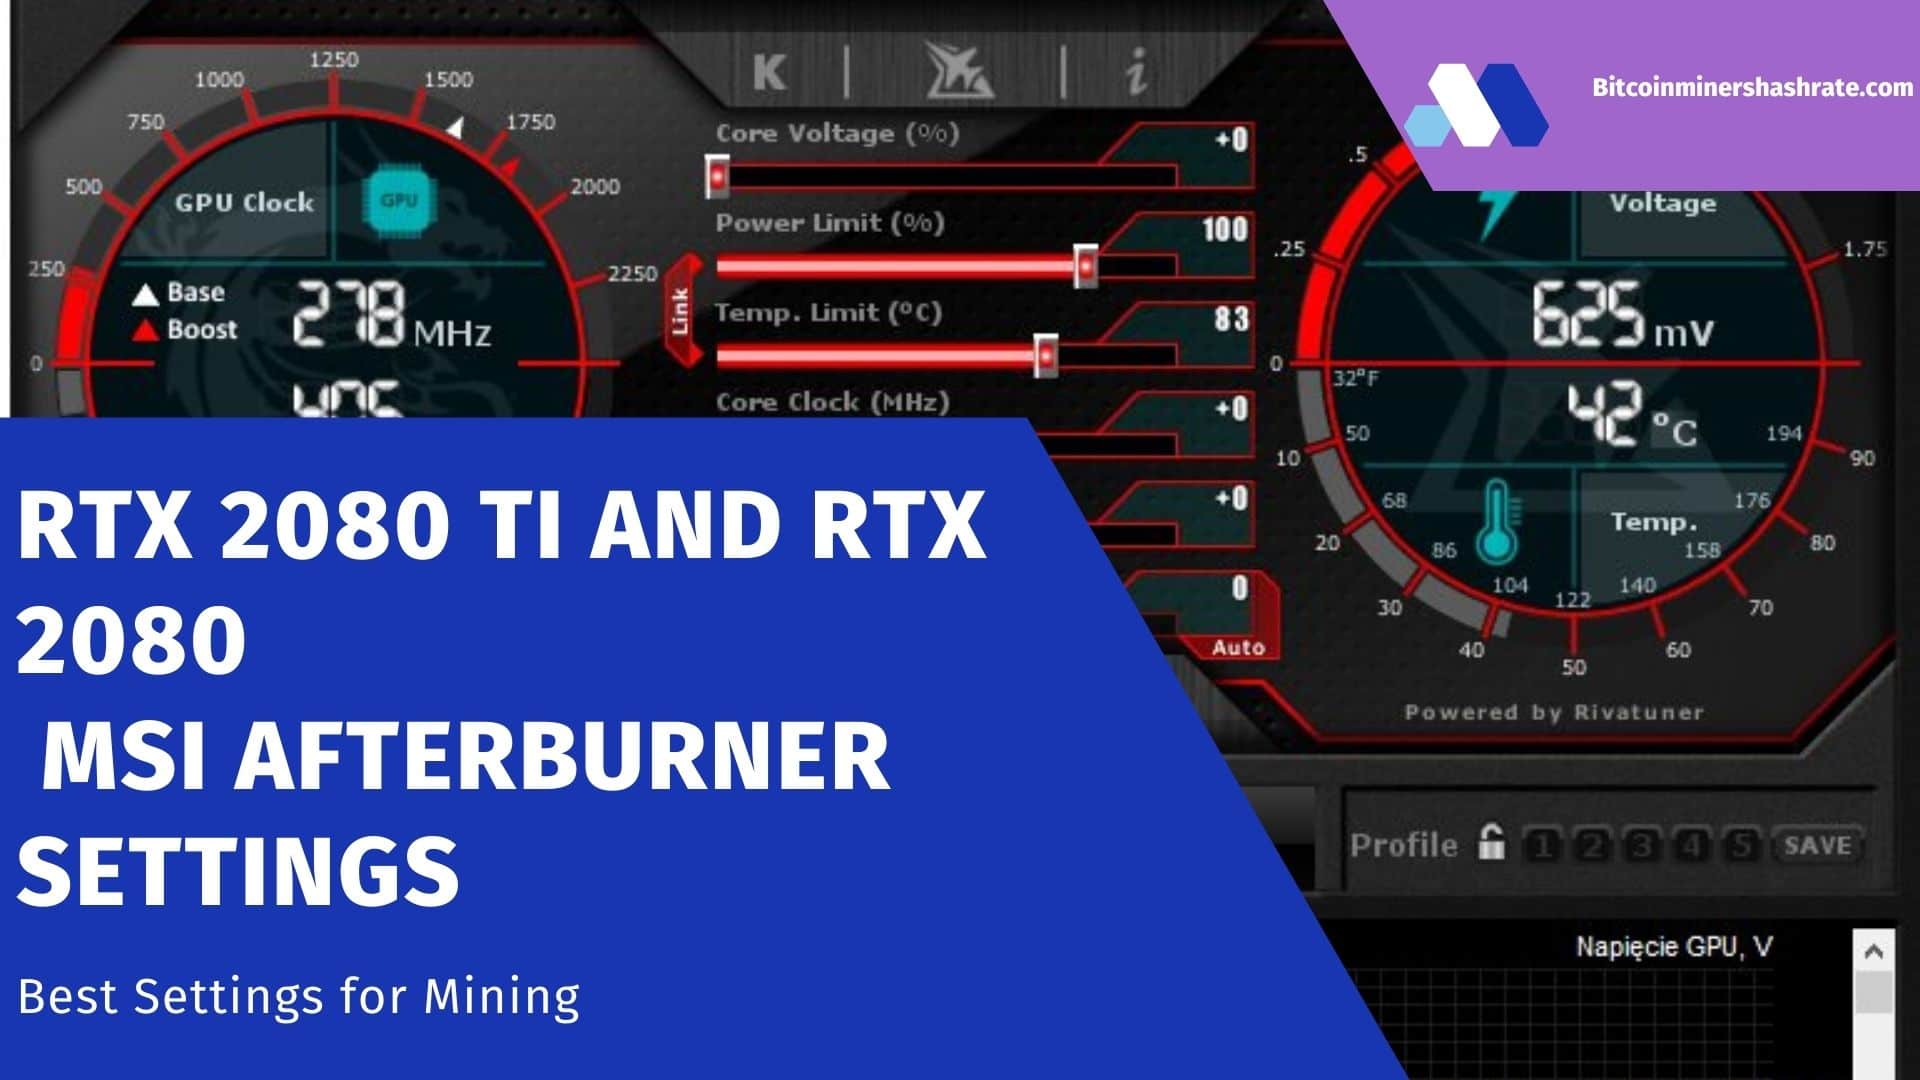
  RTX 2080 TI and RTX 2080 MSI Afterburner Settings: Best Overclocking Setup (2022)
  How to set up a graphics card cooler in MSI Afterburner: The Best Right Steps
  How to Increase Hashrate ATI Radeon HD 5850 Mining: Overlcocking | PC Assembly | Game
