Methods for testing the performance of video cards in 3D Studio Max and Maya – Much attention has been paid to testing the gaming performance of video cards GeForce 2 – GeForce 3 – GeForce 4, and the results of such tests can be easily found on the web. However, the technologies embedded in the architecture of these video cards make it possible to assume with full reason that they can be very useful not only in games, but also in 3D modeling / animation packages.
Until now, quantitative performance testing of video cards in professional 3D graphics packages has been carried out on test scenes (for example, on test scenes supplied with 3D Studio Max) and measured by the number of frames per second. Although such testing may well reveal differences in the performance of various video cards, I would still like to have results that are more applicable to a specific practical situation.
In particular, I would like to know which video card with what speed can process a geometric scene of a given complexity. On the other hand, I would like to be able to test any, and above all those scenes with which you have to work, and not just special test ones. Considering all of the above, an attempt was made to develop a methodology for quantitative testing of the performance of video cards, first for two packages: 3D Studio Max and Maya. Looking ahead, I will say that the proposed testing ideology may well be transferred to other packages, in particular – Newtek LightWave or Softimage XSI.
So, the technique outlined below is used for testing in 3D Studio Max 5.0 and Maya 4.5, and the number of geometry triangles processed per second (tr / sec.) Is chosen as the performance unit.
Testing technique
The general idea of the testing methodology follows from the most typical tasks that are assigned to a video card – acceleration of displaying three-dimensional objects of the developed scene in viewports with various transformations of the viewport (pan, zoom, rotate). Geometry refers to a three-dimensional object, the surface of which is composed of triangles, the so-called. mesh object. This caveat is essential, since there are several types of objects in 3D packages, for example, NURBS or patch, which need additional processing before transferring to display (for example, tessellation is one of the types of such processing), and the calculation of which, of course, is slower than calculation mesh’a.
The general task of accelerating transformations in viewports can be divided into three more specific ones – accelerating the display in the wireframe mode, which is intensively used at the stage of model development; in the mode of a tinted illuminated surface with smoothing (smooth & Highlight), useful for setting light, “polishing” the interaction of a three-dimensional surface with lighting and editing texture coordinates; and in the textured display mode, often used in the final stages of scene development, and in animation.
As for the hardware, in the “wireframe” display mode, the hardware transformations block is loaded without lighting; in the tinted smoothed surface mode – the transformation and lighting unit and the video card rasterization unit; in the display mode with textures, the texturing unit is additionally involved and thus the entire graphics pipeline of the video card. Thus, such tests have, on the one hand, a purely practical value, on the other hand, they test the most interesting and new technologies incorporated in the architecture of modern video cards. As I already said, transformations will mean operations of rotation, translation and scaling in the viewport (the corresponding operations in max are rotate, pan and zoom).
So what to test is clear. Now – how to test. For this purpose, a script program was written that simulates transformations in a perspective viewport and measures the execution time of one such transformation, the number of triangles processed per second and FPS – the number of frames (or what is the same – the number of transformations) per second. For us, the most important parameter is the number of triangles processed per second, since it directly shows how complex the model can be processed in the program, and since it can be directly compared with the graphics card performance declared by the developers.
For example, if a video card can process 25 million triangles per second, then we can work quite comfortably (say, at 5 FPS) in a viewport with a scene of 25/5 = 5 million triangles. In the case of 3D Studio Max, the key sequence of script commands looks like this:
time1 = timeStamp () // transformation start time;
preRotateZ matras 10 // calculate the transformation matrix (in this case, rotation along the Z axis by 10 degrees, for scaling – preScale matrix, for translation – preTranslate matrix) of the viewport coordinate system;
viewport.setTM (matras) // apply the rotation matrix to the viewport’s coordinate system;
forceCompleteRedraw // force the viewport to redraw;
time2 = timeStamp () // transformation end time;
time = time2 – time1 // time of execution of one transformation.
It should be noted that in max, transformation operations in the viewport are not animated, and moreover, there are no corresponding commands for them in the built-in scripting language. Therefore, the above sequence of commands only simulates what happens when interactively manipulating the viewport using the pan, zoom and rotate tools. In particular, I was unable to establish which method (script function) redraws the viewport when manipulated in max, so I used forceCompleteRedraw. This function is guaranteed to redraw everything in the viewport and is faster than other redraw functions (of which there are several more – for example, the max views redraw command and others). In addition, there are some problems with measuring the execution time of transformations, and this is due to how the max engine works.
In batch mode, when script commands are executed in a loop without forced drawing, max accumulates transformations and displays only the resulting transformation for display. For example, 10 turns by 10 degrees each in the script loop are displayed as one turn by 100 degrees, so the time to complete one intermediate operation is zero and cannot be measured. There are no such problems if the transformation script command is executed once (not in a loop), but new problems appear instead of old ones.
In particular, the minimum time unit for measurements in max is a tick, i.e. 1/1000 second. Therefore, if the test object consists of less than 25,000 faces, when testing one transformation on a video card with a theoretical (declared by the developer) performance of 25 million triangles per second, we can get the measured transformation time equal to 0 seconds.
The reason is that the video card processes 25,000 triangles in 1/1000 second, and if the test object consists of, say, 20,000 triangles, then its transformation time is less than 0.001 seconds, i.e. unmeasured in 3D Studio Max. The way out of this situation is to measure the execution time of cycles of tens or even hundreds of transformations, or to test objects consisting of a large number of polygons (by the way, in order to be able to test the GeForce 4 Ti4600, we need an object with more than 100 thousand polygons).
Therefore, I found the use of the forced redrawing command an acceptable compromise – it allows us to measure both the time and ensures that we measure exactly the time it takes to draw the geometry by the video card, and allows us to use transformation cycles.
The fundamental point of testing is also the manipulation of the viewport, and not the transformation (rotation, etc.) of the object itself or the camera. Let me explain why. When transforming the object itself (camera), its world coordinates change, which inevitably leads to the use of the program engine of the max itself, i.e. processor, not video card. When transforming the viewport, we actually change only the transformation matrix of the world coordinates of scene objects to the coordinates of the viewport. Max remembers this matrix (16 numbers) and transfers it to the video card to calculate the display coordinates. Thus, only manipulation of the viewport allows you to correctly measure the performance of a video card.
After all these preliminary remarks, here is the full script code, which was used to test the performance of video cards. The script works only in the perspective view window and measures the execution time of transformations in cycles. Test script: ( local matras init_matr start end stoka my_vert my_faces my_tr_time my_pc my_vc my_fps cikl ) matras = getViewTM () init_matr = getViewTM () cikl = 36 ————– the number of transformations in the loop – ——– gomasselerate ———– gw.querySupport #geomAccel gw.querySupport #triStrips
gw.querySupport #wireframeStrips
stoka = newScript ()
———————————
–statistika objects — ——
my_vert = 180345 —- number of vertices of the test object
my_faces = 334291 — number of faces of the test object
———————– ——
–START ROTATE TEST1 ————————————— ——————————————
start = timeStamp () — — start time of the transformation cycle
for i = 1 to cikl do ——- performing transformations in the cycle
(
preRotateZ matras 10 —– we get a 4×4 transformation matrix of rotation by 10 degrees along the Z axis –
preRotateX can be used or preRotateY – rotations along the X or Y axes, respectively, or
–combinations of all three
viewport.setTM (matras) – new coordinates of the object in the viewport as a result of rotation
forceCompleteRedraw doDisabled: true — full forced drawing of the viewport
) ————— ——— completion of the transformation cycle
end = timeStamp () ——– cycle end time
—– poligon & vert count – count the time of one transformation, etc. —- —————-
my_tr_time = (end – start) / (cikl * 1000.0) – time of one transformation in seconds
my_vc = my_vert / my_tr_time ——— —— the number of vertices transformed per second
my_pc = my_faces / my_tr_time ————– the number of faces transformed per second
my_fps = 1.0 / my_tr_time ———- —— number of transformations per second
—————————————– or fps – frames per second
— —– output – output of test results to a separate window ———–
format “Rotate vwp on 10dg n” to: stoka
format “time =% s. n” my_tr_time to: stoka
format “faces / s =% n” my_pc to: stoka
format “vert / s =% n” my_vc to: stoka
format “FPS =% n” my_fps to: stoka
format “———— ————————— n “to: stoka
sleep 0.4 —————- —————- pause before next test
–END ROTATE TEST1 ————————- ————————————————– ——-
——– reset ————————-
viewport.setTM (init_matr)
forceCompleteRedraw doDisabled:true
matras = getViewTM()
————————————–
–START ROTATE TEST 2——————————————————————————-
start = timeStamp()
for i = 1 to cikl do
(
preRotateZ matras -10
viewport.setTM (matras)
forceCompleteRedraw doDisabled:true
)
end = timeStamp()
—–poligon&vert count——————–
my_tr_time = (end – start)/(cikl*1000.0)
my_vc = my_vert/my_tr_time
my_pc = my_faces/my_tr_time
my_fps = 1/my_tr_time
——————————————-
————-output—————————————————-
format “Rotate vwp on -10dg n” my_tr_time to:stoka
format ” time= %s. n” my_tr_time to:stoka
format ” faces/s= % n” my_pc to:stoka
format ” vert/s= % n” my_vc to:stoka
format ” FPS= %n” my_fps to:stoka
format “————————————— n” to:stoka
sleep 0.4
–END ROTATE TEST 2———————————————————————————
——–reset————————-
viewport.setTM (init_matr)
forceCompleteRedraw doDisabled:true
matras = getViewTM()
————————————–
–START SCALE TEST OUT—————————————————————————-
start = timeStamp()
for i = 1 to cikl do
(
prescale matras [0.9, 0.9, 0.9] false
viewport.setTM (matras)
forceCompleteRedraw doDisabled:true
)
end = timeStamp()
—–poligon&vert count——————–
my_tr_time = (end – start)/(cikl*1000.0)
my_vc = my_vert/my_tr_time
my_pc = my_faces/my_tr_time
my_fps = 1/my_tr_time
——————————————-
————-output—————————————————-
format “Scale_out vwp n” to:stoka
format ” time= %s. n” my_tr_time to:stoka
format ” faces/s= % n” my_pc to:stoka
format ” vert/s= % n” my_vc to:stoka
format ” FPS= %n” my_fps to:stoka
format “————————————— n” to:stoka
sleep 0.4
———————————————————————–
–END SCALE TEST OUT——————————————————————————-
–START TEST SCALE IN——————————————————————————–
start = timeStamp()
for i = 1 to cikl do
(
prescale matras [1.1, 1.1, 1.1] false
viewport.setTM (matras)
forceCompleteRedraw doDisabled:true
)
end = timeStamp()
—–poligon&vert count——————–
my_tr_time = (end – start)/(cikl*1000.0)
my_vc = my_vert/my_tr_time
my_pc = my_faces/my_tr_time
my_fps = 1/my_tr_time
——————————————-
————-output—————————————————-
format “Scale_in vwp n” to:stoka
format ” time= %s. n” my_tr_time to:stoka
format ” faces/s= % n” my_pc to:stoka
format ” vert/s= % n” my_vc to:stoka
format ” FPS= %n” my_fps to:stoka
format “————————————— n” to:stoka
sleep 0.4
———————————————————————–
–END SCALE TEST IN——————————————————————————-
——–reset————————-
viewport.setTM (init_matr)
forceCompleteRedraw doDisabled:true
matras = getViewTM()
————————————–
–STAR TRANSLATE TEST 1————————————————————————-
start = timeStamp()
for i = 1 to cikl do
(
preTranslate matras [-50, 0, 0]
viewport.setTM (matras)
forceCompleteRedraw doDisabled:true
)
end = timeStamp()
—–poligon&vert count——————–
my_tr_time = (end – start)/(cikl*1000.0)
my_vc = my_vert/my_tr_time
my_pc = my_faces/my_tr_time
my_fps = 1/my_tr_time
——————————————-
————-output—————————————————-
format “Translate 1 vwp n” to:stoka
format ” time= %s. n” my_tr_time to:stoka
format ” faces/s= % n” my_pc to:stoka
format ” vert/s= % n” my_vc to:stoka
format ” FPS= %n” my_fps to:stoka
format “————————————— n” to:stoka
sleep 0.4
–END TRANSLATE TEST1—————————————————————————-
–START TRANSLATE TEST 2————————————————————————-
start = timeStamp()
for i = 1 to cikl do
(
preTranslate matras [50, 0, 0] –X
viewport.setTM (matras)
forceCompleteRedraw doDisabled:true
)
end = timeStamp()
—–poligon&vert count——————–
my_tr_time = (end – start)/(cikl*1000.0)
my_vc = my_vert/my_tr_time
my_pc = my_faces/my_tr_time
my_fps = 1/my_tr_time
——————————————-
————-output—————————————————-
format “Translate 2 vwp n” to:stoka
format ” time= %s. n” my_tr_time to:stoka
format ” faces/s= % n” my_pc to:stoka
format ” vert/s= % n” my_vc to:stoka
format ” FPS= %n” my_fps to:stoka
format “————————————— n” to:stoka
sleep 0.4
–END TRANSLATE TEST 2—————————————————————————-
——–reset————————-
viewport.setTM (init_matr)
forceCompleteRedraw doDisabled: true
matras = getViewTM ()
————————————–
–END WHOLE TEST ———————- This script was entered in the script editing window in max and was launched for execution by pressing the Ctrl + E key combination. The results are displayed in a separate window, from where they can be saved to a text file. The size and position of the output window can be changed, max will remember the changes made and next time it will open a new window of the same size and in the same place on the screen. This is the testing methodology in 3D Studio Max, and the performance of the video card measured in this way is in good agreement with the intuitive sense of performance when actually manipulating in the viewport.
For testing in Maya, the same ideology was used, but taking into account the peculiarities of the MEL scripting language. In particular, Maya has scripted animatable transformation commands in the viewport, as well as calculation capabilities and means of displaying statistics of object geometry and animation speed in frames (FPS) in the viewport from the main menu, with constant updating during script execution. In addition, working with a script in Maya is much easier – just write it in the Maya script editor and then select and drag the text onto the Shelf Tabs. As a result, we get a button under the main menu, by pressing which the script body is executed. Here are the scripts themselves: Rotations cikle orbit int $ i = 0; while ($ i <145) { orbit -ha 5;
refresh -cv; —- command for forced redrawing of the viewport
$ i = $ i + 1;
}
displayStats -fr true;
int $ i = 0;
while ($ i <145)
{
orbit -ha -5;
refresh -cv;
$ i = $ i + 1;
} Rotations cikle roll_l int $ i = 0; while ($ i <147) { roll -d 5; refresh -cv; $ i = $ i + 1; } Rotations cikle roll_2 int $ i = 0; while ($ i <147) { roll -d -5; refresh -cv; $ i = $ i + 1; } Scaling cikle dolly int $ i = 0; int $ c = 400; while ($ i <81) { dolly -abs -d $ c persp;
refresh -cv;
$i = $i + 1;
$c = $c – 5;
}
$i = 0;
while ($i < 81)
{
dolly -abs -d $c persp;
refresh -cv;
$i = $i + 1;
$c = $c + 5;
}
Трансляции cikle track
int $i = 0;
while ($i < 100)
{
track -d 0.1;
The part of the code under the heading is a separate test script, each can have its own button. You can enter the entire script for one button (removing the headings), then all tests will be executed together, sequentially one after the other. The meaning of the tests is the same – imitation of transformations (rotations, scaling and translations) in the viewport. To display the statistics of the object’s geometry, you need to use Display> Heads UP Display> Poly Count, and the proportion of displaying the FPS value in the viewport – Display> Heads UP Display> Frame Rate.
Obviously, this technique can be reproduced in any 3D modeling and animation package that has a sufficiently developed scripting language.
Tests
Without dwelling on the “bare” theory, I used the above methodology to perform some practical tests, the results of which are given below.
The first tests were performed in 3D Studio Max 5.0 for two APIs – OpenGL and Direct3D, as well as in Software mode in three display modes – wireframe, smooth & highlight and smooth & highlight with texture display. As a test three-dimensional object in a scene with one omni-light source, we used a medium-complexity tank mesh model from the EsponaModel library samples freely distributed on the network. Here is its view in wireframe, smooth & highlight display modes and with textures:
Fig. 1 Test model in three display modes
Its quantitative indicators: triangular faces – 334291, vertices – 180345, texture maps – 4, one of which is multi-part (of 6 texture maps). Testing in max was carried out for the case of one viewport deployed to full screen, screen resolution – 1152×864 85 Hz.
For testing, we used a computer based on Intel Pentium 4 2GHz, 512 Mb PC2100 DDR SDRAM, operating system – Windows 2000 SP2, DirectX 8.1. The tested video cards Riva TNT 32 MB, GeForce 2 Pro 64 MB DDR, GeForce 3 Ti200 64 MB DDR. The inclusion of Riva TNT in a number of tested video cards is conditioned by the desire to compare the performance of two qualitatively different classes of video cards – with hardware T&L (all GeForce) and without it (RivaTNT).
In all cases, Detonator version 41.09 was used as video card drivers. All settings available from the operating system are by default, except for disabling vertical sync. In 3D Studio Max, the Implementation-Specific Settings> Use Wireframe Faces (Custom Driver Extension) option was required for the OpenGL API, in the Direct3D API – Geometry> Use Triangle Strips> For Wireframe Objects. Both options significantly speed up the display in viewports.
First of all, for comparison, the performance was measured in the Software mode, i.e. calculated only by the central processor: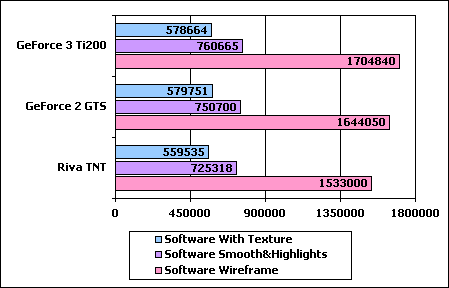
Diagram 1
The maximum performance in this case was about 1.8 million triangles per second in wireframe display mode. In the shaded surface mode, the performance dropped by more than half and amounted to about 800 thousand triangles per second, and in the display mode with textures – 600 thousand triangles, i.e. three times less. Software performance was measured with all video cards and increased slightly for cards with higher GPU frequencies.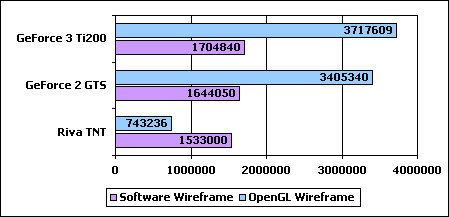
Diagram 2. Display mode Software Wireframe
and OpenGL Wireframe Diagram 3. Display mode Software Smooth & Highlight and OpenGL Smooth & Highlight Diagram 4. Display mode Software Smooth & Highlight with textures and OpenGL Smooth & Highlight with textures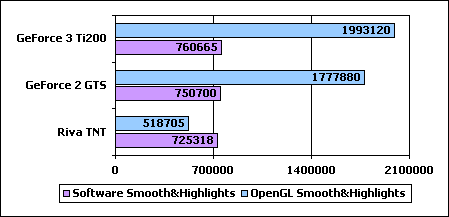
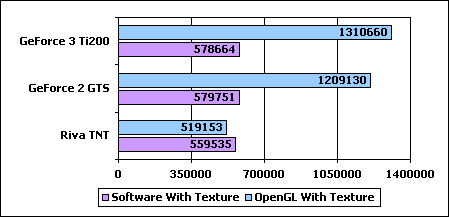
Diagrams 2-4 show the comparative performance of the tested video cards in Software and OpenGL in three modes. When analyzing the results of these diagrams, it should be borne in mind that transformations in Software are calculated only by the processor, and in OpenGL – only by the GPU. In the tests in the Software mode, the processor calculated only transformations, in real tasks, the processor will be assigned many other tasks, so the software performance in real tasks will always be significantly lower than that calculated in the tests. The performance record belongs to GeForce 3 and is 3.7 million triangles per second in wireframe display mode. So the results themselves are impressive – GPU GeForce 2 and 3 “make” the processor in performance in all modes, and the difference in performance is significant.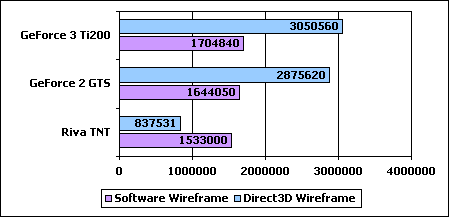
Diagram 5. Software Wireframe
and Direct3D Wireframe display mode Diagram 6. Software Smooth & Highlight and Direct3D Smooth & Highlight display mode Diagram 7. Software Smooth & Highlight display mode with textures and Direct3D Smooth & Highlight with textures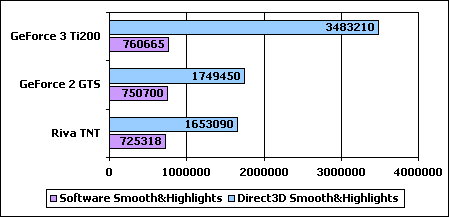
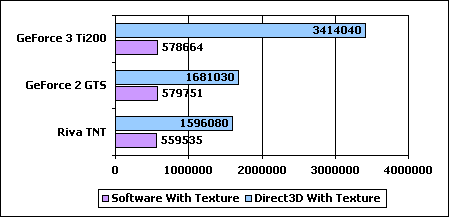
But this result is somewhat unexpected. It follows from it that the performance of video cards using the Direct3D API in the case of lighting and texturing calculations is much higher than when using OpenGL. But in the calculations of “pure” geometry (wireframe mode), everything is exactly the opposite. However, it is possible that this is due to the choice of gaming video cards for testing, and for professional video cards the results may be different.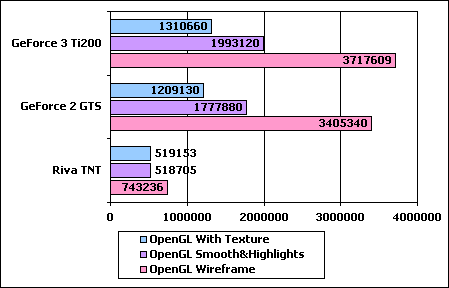
Diagram 8. Comparative performance results of
all tested video cards in OpenGL in three
display modes . Diagram 9. Comparative performance results of all tested video cards in Direct3D in three display modes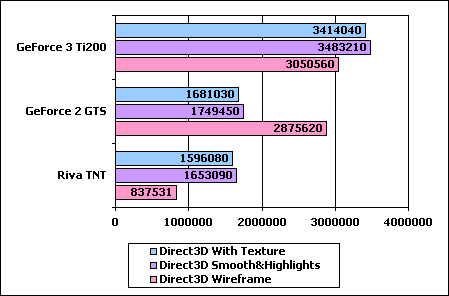
The result shown in Diagram 9 is quite logical – here both the pixel pipeline and the general optimization of the GeForce 3 architecture show themselves in all their glory.
And finally, I would like to give a summary table of the test results for all video cards in all modes.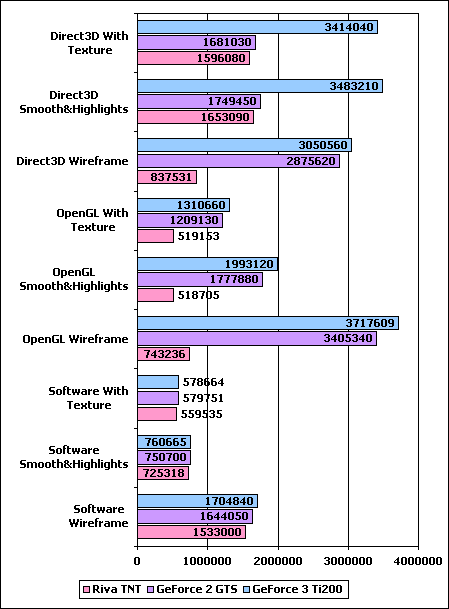
Diagram 10
All the results obtained are not original and have been known for a long time. I present them for “illustrative” purposes only, to demonstrate the performance of the proposed testing methodology.
Main conclusions
- All GeForce series graphics cards outperform the CPU for 3D rendering, especially when using the Direct3D API for lighting and texturing calculations. The result of the GeForce 3 is remarkable – the performance of this video card is in most cases higher than that of its predecessors. I would venture to suggest that GeForce 4 with its even more optimized architecture, additional (second) T&L pipeline and increased clock speed will be able to show even more impressive performance results. This, coupled with the falling prices for these graphics cards, makes them a very smart choice to buy. If you work in 3D Studio Max, then buying a good video card will be much more profitable than installing a second processor (of course, if we are not talking about the final rendering, which is executed by the processor). Despite this, it should be noted that the measured practical performance of video cards is strikingly different from the theoretical performance declared by nVidia.
- It is clearly seen that, at least for gaming video cards, OpenGL is inferior in performance to Direct3D.
- By all indications, the evolution of the development of display technologies has headed towards the use of vertex and pixel shaders. Proof of this is both the dynamics of the performance of video cards in these modes and the embedding of possibilities for interactive display in the viewports of hardware shaders both for 3D Studio Max (plugin CgFX), and for Softimage, and for Maya. The CgFX plugin also uses the Direct3D API exclusively in its work (even in the case of Maya).
Moving on to the test results in Maya 4.5
For the tests, the same geometric object was used as in max, exported in the .obj format and optimized in Maya, but without textures. The quantitative indicators of vertices and faces also remained the same.
Since Maya does not know anything about the existence of different APIs (or rather, only knows OpenGL), the tests were carried out once for two display modes.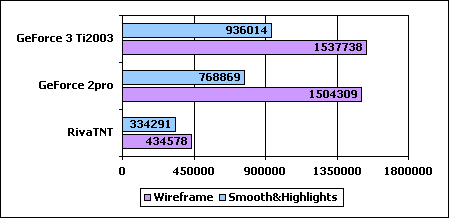
Diagram 11
The conclusion is obvious. Maya is almost indifferent to which GeForce is installed on the system. Therefore, to work in Maya, buying a second processor is more profitable than buying a GeForce 4. In conclusion, I would like to say that the described test scripts can work with any scene, it is only necessary for 3D Studio Max to manually enter the number of vertices corresponding to that object into the appropriate place of the script, which is in the viewport. The author expresses his deep gratitude to Timofey Cheblokov for constructive comments and help in preparing the article.
Related posts:
 Bitmain Antminer r4 Review – Benefits Profitability Payback Specification
 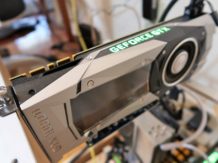 Nvidia GTX 1080 ti Hashrate – Review | Overclocking |Ethereum |Profit (sky high)
  Antminer S5 ASIC Hashrate – Review Profitability Payback Period
  Asic Antminer S1 Hashrate – Review | Test| Specs| Pros & Cons | Set-up|
  Miner Baikal Giant x11 – Hashrate|Profitability| Specs
 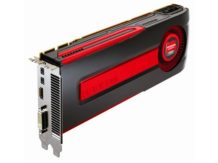 Radeon Hd 7970 Hashrate -Review|Profitability | Specs | Pros and Cons