


It seemed to go well for a long time with the bitcoin course. Until Wednesday, July 10 at four o’clock Dutch time. The rate then fell in just one hour with more than 500 euros in value. From then on it went quickly. From Wednesday to Thursday evening, the exchange rate fell by almost two thousand euros.
Do we have to worry? Or is this a temporary correction?
Positive divergence and support
Bitcoin still has opportunities in the short term. The divergence is positive on the one-hour graph. That means that the price drops lower, but that an indicator shows higher drops.
In the graph below you can see the bitcoin rate, the RSI and the MACD. The rate is falling, but the indicators are showing recovery. In the long run, that is positive for the course.
And that seems to be the case now. At the time of writing, the rate is rising. The course also seems to have found support in an important zone. We have indicated this zone on the graph with the green rectangle.
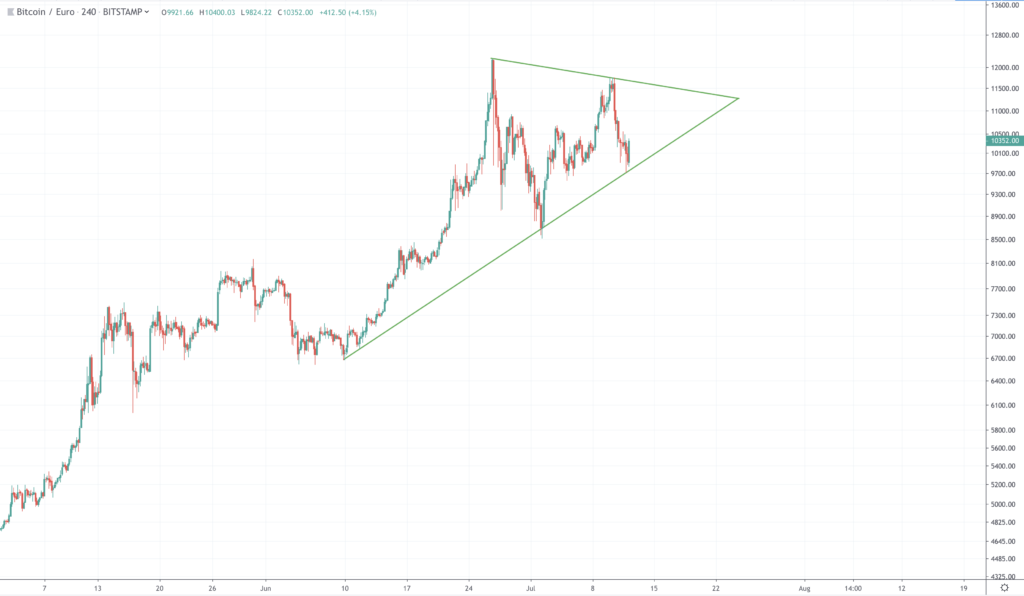
Bullish pennant can cause an increase
We zoom out the graph a little, each candle now represents four hours. In the somewhat longer term we see a bullish pennant. That is a difficult word for the green triangle in which the course is now moving.
If the price continues to move in this triangle, then that is a positive sign for the price. In the event of an outbreak at the top, the value of bitcoin can increase considerably. In that case, the highest point of 2019 will soon be reached again.
But if the price falls below, bitcoin can fall below 10,000 euros. It will remain exciting in the coming days ..
What can we expect from the bitcoin rate?
The positive divergence and the bullish pennant are both positive signals for the bitcoin rate. On the other hand, the bitcoin rate has been in positive momentum for a few weeks. A correction is therefore not a crazy scenario at all.
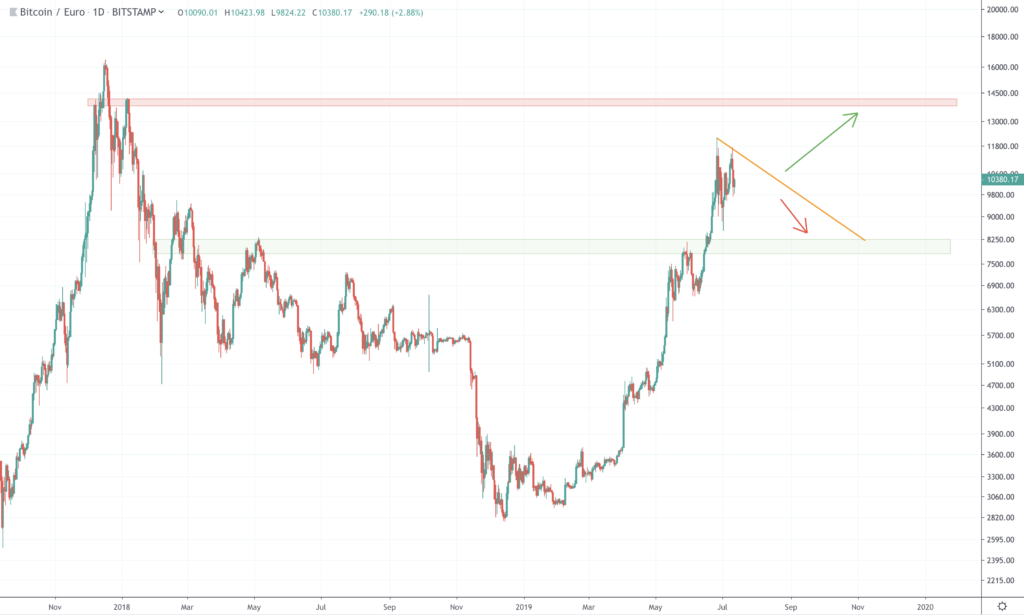
That is why we outline two options: positive (bullish) and negative (bearish). We zoom out the graph again, each candle now sets
Bullish
In the positive scenario, the bitcoin rate breaks through the orange trend line. This forms the top of the bullish pennant that we discussed earlier.
Will the bitcoin course succeed in breaking through this trend line? Then the next resistance is around 14,000 euros. We have indicated this resistance in red on the graph. In this zone, the bitcoin exchange rate at the end of December and the beginning of January also resisted.
Bearish
But does the bitcoin fail to stay in the triangle? Then we can expect a correction again. In the most negative scenario, the rate then drops to 8,000 euros. The rate is likely to find support here. On the graph we have indicated this zone with the green rectangle.
Related posts:
 Why do cryptocurrency Exist – Institutions
  Bitcoin and independent property rights
  NASDAQ on market manipulation: Everyone is now talking about regulating bitcoin and cryptocurrency
  Pilot Porsche on Ethereum blockchain to trace provenance materials
  Xfers from Singapore is going to use blockchain Zilliqa
  Make your own tokens with the Guarda wallet


