
Bitcoin (BTC): Again in the wake of the classic financial market
BTC-Kurs: $20,261 (previous week: $19,196)
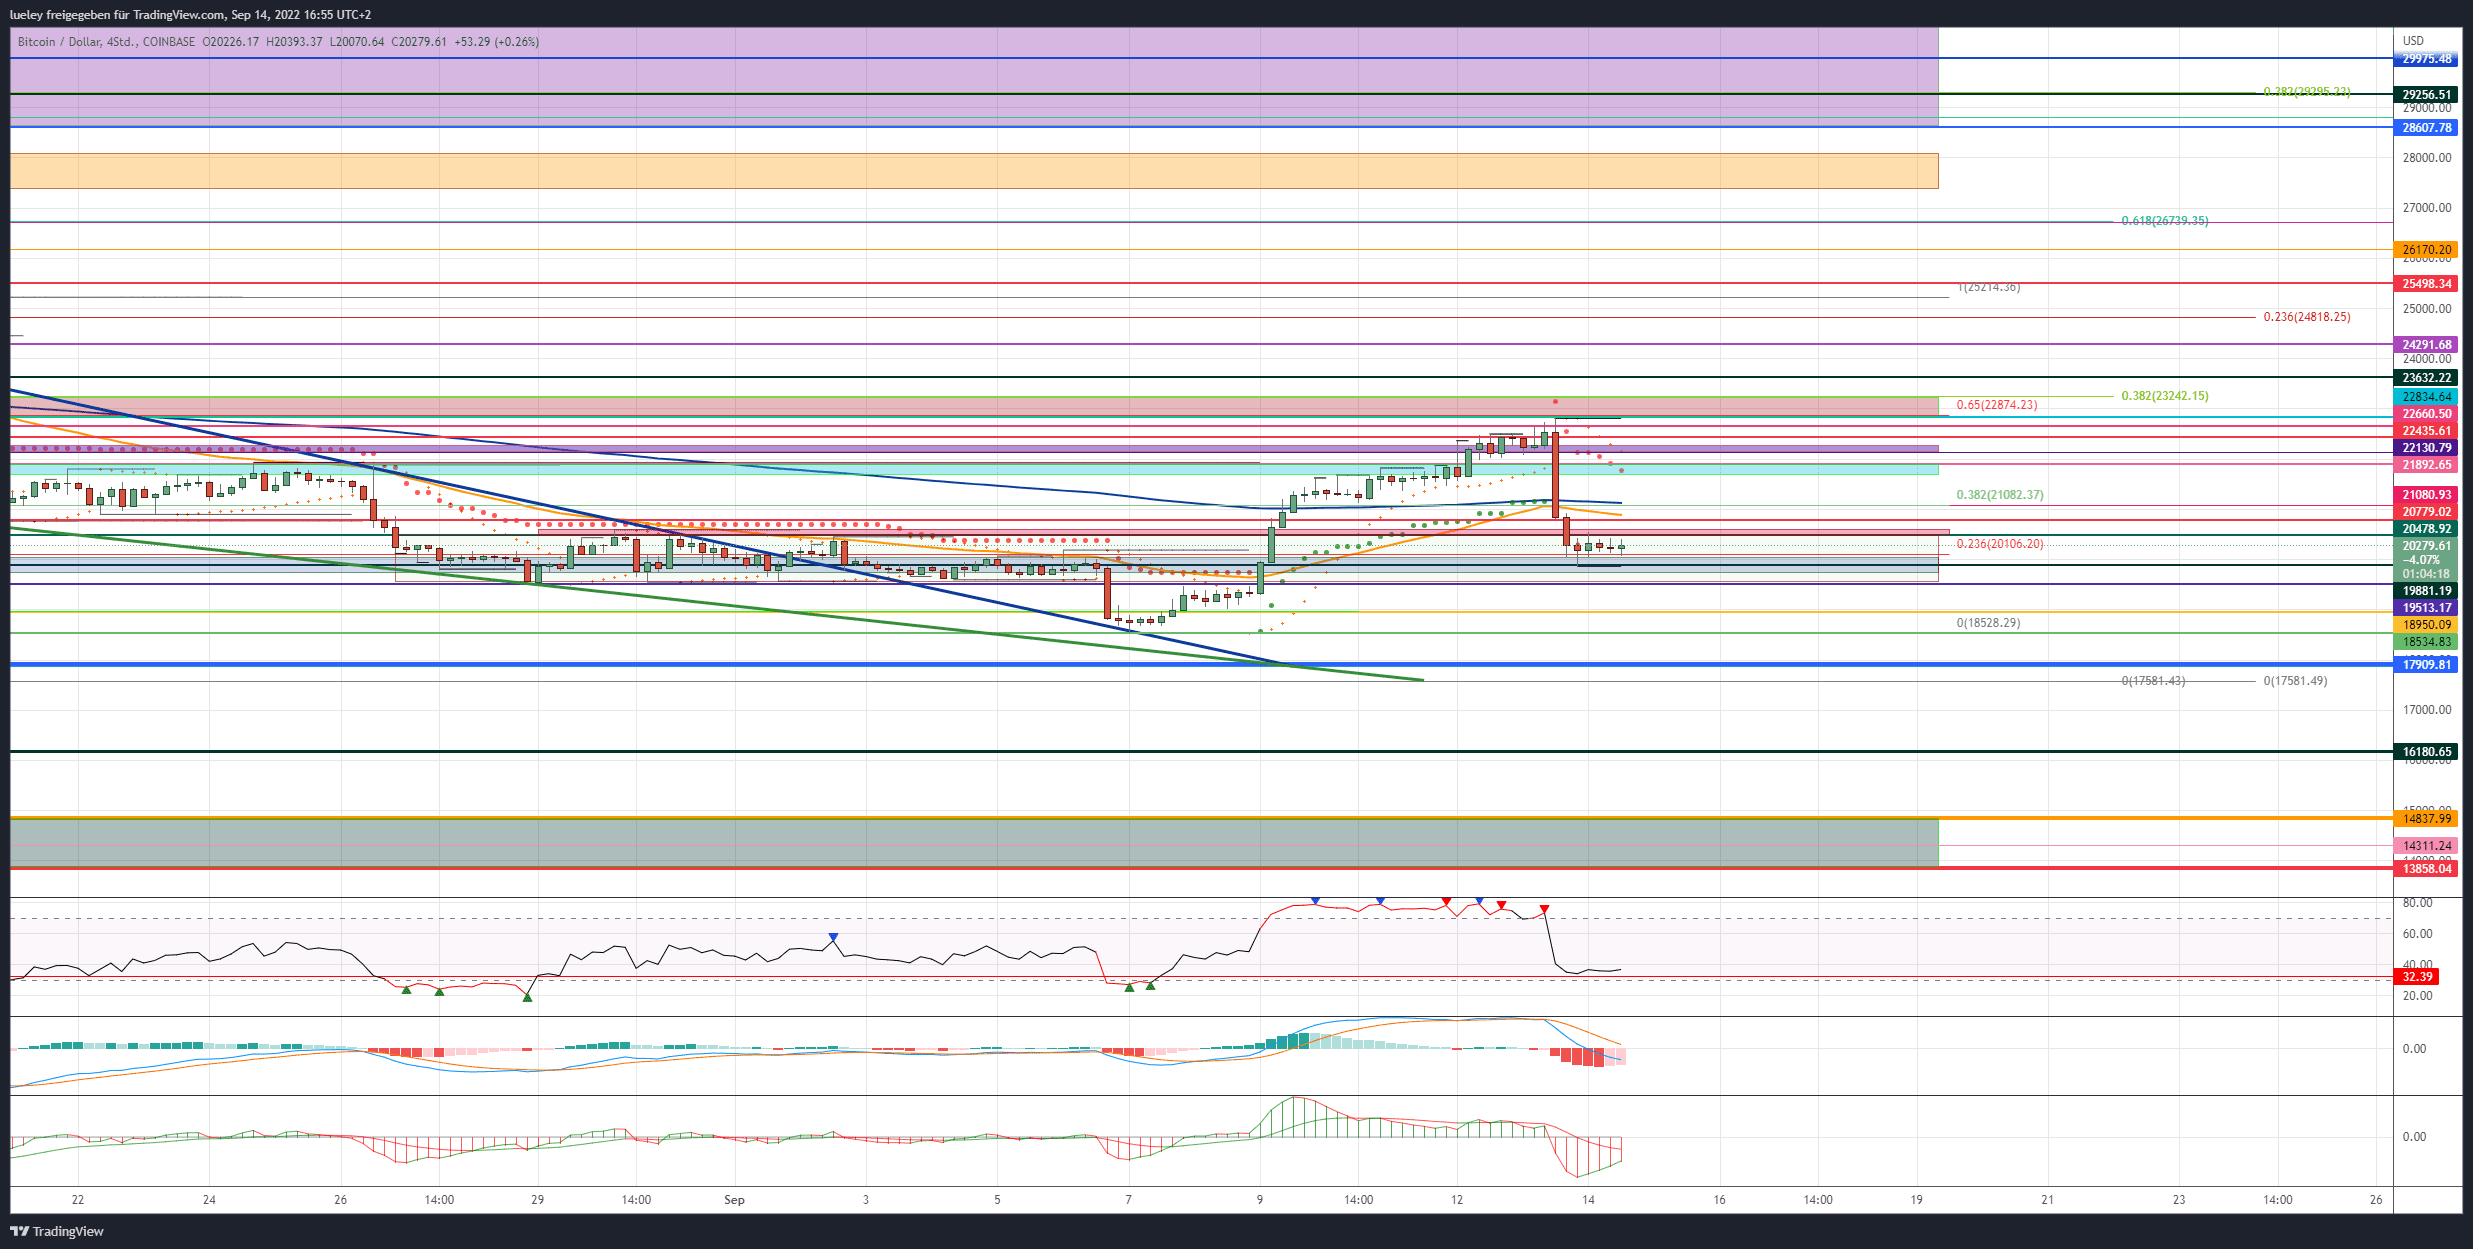
Short-term resistances/goals: 20.478 USD,20.779 USD, 21.080 USD, 21.691/21.892 USD, 22.130 USD, 22.435 USD, 22.834 USD, 23.218 USD,23.632 USD, 24.291 USD, 24.814 USD, 25.498 USD, 26.170 USD, 26.734 USD, 27.696/28.104 USD, 28.607 USD, 29.256 USD, 29.975 USD, 30.612 USD, 31.750 USD, 32.443/32.938 USD
Short-term supports: 19.881 USD, 19.513 USD, 18.950 USD, 18.534 USD, 17.909/17.567 USD, 16.180 USD, 14.838 USD, 14.311 USD, 13.858 USD
Recap Bitcoin
- Bitcoin hit the relevant price target at $22,834 on Tuesday afternoon before fresh inflation data dashed bulls’ hopes of a rally back above $24,000.
- Yesterday’s sell-off following the announcement of an unexpected increase in the US consumer price index (CPI) not only caused a real sell-off on the US stock markets. As a result, market participants are now expecting the US Federal Reserve to raise interest rates by 75 basis points next Wednesday, September 21 instead of 50 basis points. Some analysts even see a rate hike of 100 basis points as justified.
- Not only were US shares sold across the board, but the trading day for the key cryptocurrency Bitcoin also ended with a price drop of 10 percent at USD 20,180. The BTC price was at least able to save itself back above the psychologically important USD 20,000 mark shortly before the end of the day. At its peak, Bitcoin had broken back by 12 percentage points to the old all-time high from 2017 at USD 19,881.
Bitcoin: price follows downtrend on the stock market
- In view of the almost six percent price correction in the Nasdaq100 technology index – the strongest sell-off since March 2020 – this should not come as a surprise. Even blue-chip technology stocks such as Apple and Amazon.com corrected up to seven percentage points and ended the trading day at the daily low.
- The fact that 495 out of 500 stocks in the largest stock index S&P500 ended the day in the red indicates that investors are capitulating.
- In particular, the strong comeback of the US dollar index DXY had a negative impact on all stock sectors and the crypto market.
- For the time being, the hope of a timely bottom formation, as suggested by many indicators, seems to have been dashed.
- Although Bitcoin can hold its own relatively well this Wednesday, there can be no talk of stabilization so far.
- Investors are already eyeing the release of new inflation data for the euro zone on Friday 16th September. If the consumer price index (CPI) in Europe is again above the analysts’ expectations of 9.1 percentage points, as in the previous month, renewed headwinds can be expected, primarily for growth areas such as the crypto sector.
- The fact that Bitcoin, after a false breakout on the downside in the previous week, has now made a false breakout on the upside in the current trading week shows the indecision of investors.
- In the short term, Bitcoin is back in the old trading range between USD 19,513 and USD 20,779.
- With yesterday’s sell-off, Bitcoin is now back below the EMA50 (orange), which it had just regained last week after several bounces in the past few months.
- If a timely reconquest fails and Bitcoin slips again sustainably below USD 19,884 towards USD 19,513, the bulls must be there to avert a relapse to the previous week’s low of 18,534.
- On the other hand, the chart image only brightens when it stabilizes above USD 20,779.
DXY comes into focus
- Investors should continue to keep an eye on the price development of the US Dollar Index DXY. More downward momentum can only be expected when the DXY forms new lows.
- Only then would there be more room for a more sustainable price recovery of the key crypto currency.
- It is also important to keep an eye on the trading volume. As long as the Bitcoin price does not trend north with an increasing trading volume, another slide in the price could be repeated at any time in the coming days and weeks.
- The weakness of the Bitcoin dominance is also bearish. Whether the BTC market dominance can again form a bottom in the 40 percent mark must be viewed critically in view of the last setback.
- It is currently difficult to say whether Ethereum’s (ETH) “The Merge” on Ethereum2.0 will have a positive effect on the price development of Bitcoin. Investors around the world are currently eagerly awaiting the biggest event in crypto history.
That’s what the indicators say
- Despite yesterday’s sell-off, the Fear and Greed Index is able to stabilize at a value of 27, at least for the time being in the “fear” area. However, a sustained course correction should quickly push the fear barometer back into the “extreme fear” zone.
- The RSI is now trading again at the lower edge of the neutral zone at 45 in the daily chart. As long as the 55 is not recaptured here, no price support is to be expected from the indicator side. Looking at the 4-hour chart, the RSI is now back in the oversold segment at 32. Bitcoin price stabilization is conceivable, at least in the short term. The MACD, on the other hand, still has an active sell signal, which complicates the interpretation of the indicators used. The indicators reflect, so to speak, the indecisiveness of investors.
- A lasting brightening of the chart for Bitcoin is only given when the weekly high of USD 22,834 is recaptured. As mentioned several times, the trend recovery must be supported by an increasing trading volume.
- The bears continue to hold the scepter firmly in their hands for the moment.
Bullish Scenario (BTC)
- Bitcoin bulls once again had to bury their desire for a trend move towards $24,000 yesterday Tuesday.
- Now the buyer camp should do everything possible to heave Bitcoin back above the red resistance area at USD 20,500 in a timely manner.
- However, in order to initiate a renewed upward movement, Bitcoin must then also recapture the zone around USD 20,800 and thus break out again above the EMA50.
- Should the jump back above these two resist areas succeed, the bulls must not let up and must immediately try to move Bitcoin above USD 21,080 towards the turquoise resistance zone at USD 21,892.
- The turquoise resistance area will again provide a hurdle on the way back towards the weekly high.
- Only if the buyer camp succeeds in stabilizing the Bitcoin price above the turquoise resist zone with increasing trading volume does the chance of a sustained recovery movement in the direction of the purple resistance area increase.
- If Bitcoin can then dynamically break out above USD 22,130 and the resistance at USD 22,435, another directional decision at USD 22,834 is to be planned.
Bitcoin course: “Golden Pocket” crucial
- Only when the Bitcoin price can pulverize the multiple resistance area from Golden Pocket of the last downward movement, horizontal resist and 38 Fibonacci retracement of the entire downward path, new price targets at USD 23,632 and especially USD 24,291 come into focus.
- If the buyer camp dynamically breaks through this important resistance level in the coming weeks, the next resistance at USD 24,814 will come into focus. As in August, clear resistance from sellers is to be expected here.
- The 23 Fibonacci retracement of the complete downward movement, which is located here, could not be recaptured in the long term.
- However, this strong resistance must be overcome in the long term in order to release further potential for growth.
- Should the historical high of USD 25,214 be recaptured at the daily closing price as a result, the next relevant target at USD 26,170 will come into the focus of investors.
- A preliminary decision for the coming period can be expected at the 61 Fibonacci retracement at USD 26,734.
- Only if this resist can also be broken through sustainably would there be room for a jump towards USD 28,000.
Bearish Scenario (BTC):
- The bears are bursting with strength. Once again they put the cops in their place.
- If the seller succeeds in undercutting the support mark at USD 19,881 at the end of the day in the coming days, there will be another directional decision at USD 19,513.
- Should the BTC price give up this important support mark again, the chart picture will become even cloudier. A direct retracement to at least $18,950 would be likely. If Bitcoin doesn’t flip north here, the bears will target last week’s low.
- If the USD 18,531 mark does not hold, the sell-off extends straight to the cross-support at USD 17,909. In the first attempt, Bitcoin should bounce north here. In view of the difficult situation on the stock markets and the flood of numbers over the next seven trading days, it is difficult to predict whether the bulls will succeed in stabilizing for the long term.
- If the buyers let the last chance of a course reversal to the north pass, the annual low at USD 17,567 will come into focus.
- If the annual low breaks as part of another sell-off on the stock markets, a direct sell-off of up to USD 16,180 should be planned for.
- A march through to the repeatedly mentioned bearish target zone between USD 14,837 and USD 13,858 would also be increasingly conceivable.
Disclaimer: The price estimates presented on this page do not represent buy or sell recommendations. They are merely an assessment by the analyst.
The chart images were created using TradingView created.
USD/EUR exchange rate at the time of going to press: EUR 1.00.
Do you want to buy cryptocurrencies?
Trade the most popular cryptocurrencies like Bitcoin and Ethereum with leverage on Plus500, the leading platform for trading CFDs (77 percent of retail accounts lose money with the provider).
To the provider