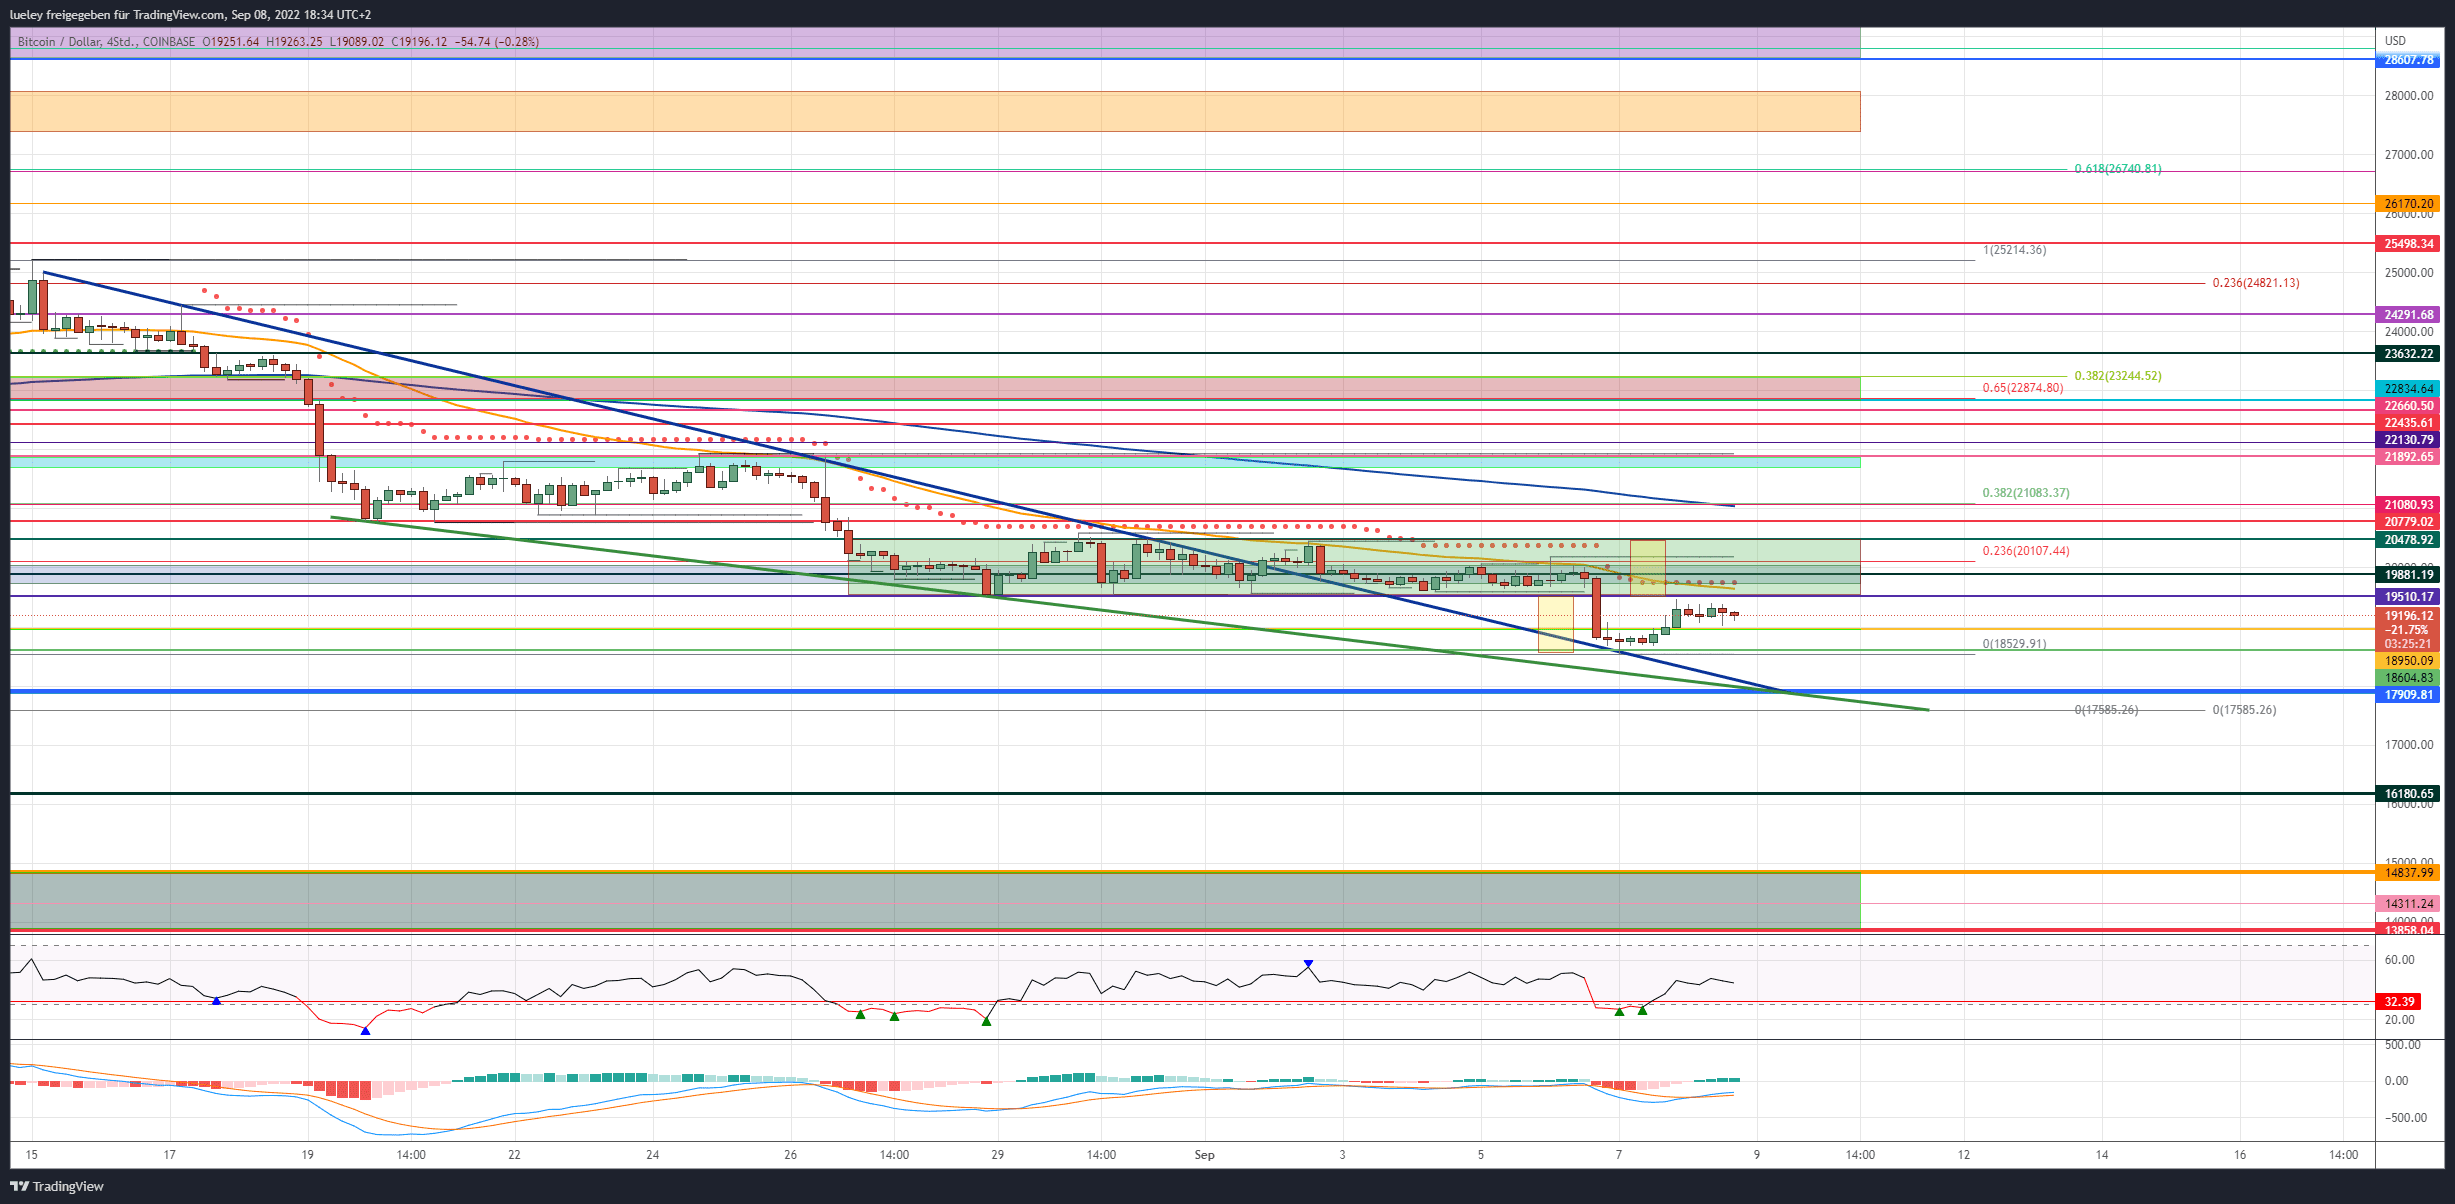
Bitcoin (BTC) price is correcting to the support at $18,604 after a bearish break of sideways trend.
BTC-Kurs: $19,196 (previous week: $19,712)
Short-term resistances/goals: 19.513 USD, 19.881 USD, 20.478 USD,20.779 USD, 21.080 USD, 21.691/21.892 USD, 22.130 USD, 22.435 USD, 22.834 USD, 23.218 USD,23.632 USD, 24.291 USD, 24.814 USD, 25.498 USD, 26.170 USD, 26.734 USD, 27.696/28.104 USD
Short-term supports: 18.950 USD, 18.604 USD, 17.909/17.567 USD, 16.180 USD, 14.838 USD, 14.311 USD, 13.858 USD
Recap Bitcoin
- The weakness on the classic stock market again had a negative effect on the price development of the key crypto currency Bitcoin at the beginning of the week.
- As a result, Bitcoin dynamically broke out of its two-week sideways range to the south on Tuesday evening and almost exactly reached the price target of USD 18,561 derived from the measured move. At $18,531, Bitcoin price undershot the range break target by $30.
- As a result, Bitcoin recovered in the last two trading days back above the old support at 18,950 and, with a current price of USD 19,320, is now heading towards the broken lower edge of the range at USD 19,513.
- The key interest rate increase by the European Central Bank (ECB) published a few hours ago by 75 basis points to 125 basis points has not yet again had a negative effect on the BTC rate thanks to a slight recovery in the euro exchange rate against the US dollar.
These price markers will be relevant for now
- In the short term, around USD 19,513, it should be decided whether Bitcoin will be able to rise back above the EMA50 (orange), which recently could not be overcome several times, this time.
- If a reconquest fails and Bitcoin slips below USD 18,950 again, another retest of the area around the weekly low is to be planned.
- Investors should continue to keep an eye on the price development of the US Dollar Index DXY. Only when the DXY corrects sustainably south after reaching a new 20-year high will there be more room for a price recovery of the key crypto currency.
Political decisions move prices
- Volatility is likely to remain elevated in light of the upcoming EU summit tomorrow Friday and the release of fresh CPI inflation data from the US next Tuesday 13th September.
- It is also important for investors to keep an eye on the price development of the US stock indices. The price recovery in the Nasdaq and S&P500 in the last 24 hours of trading is currently having a supportive effect on the BTC price.
That’s what the indicators say
- The bearish breakout from the sideways range caused the Fear and Greed Index to correct back into the extreme fear range in the last few trading days. With a value of 20, the fear barometer is still a long way from its low for the year. Only a price recovery back above USD 19,881 in the direction of the last high at USD 20,478 should calm things down here.
- The RSI as well as the MACD indicator were able to generate slight buy signals again for the time being after falling back into the oversold area on Tuesday evening. On a daily basis, both indicators remain in bearish territory. Although there are slight bullish course divergences in the RSI in the shorter time units, these must be viewed critically in view of the difficult situation.
- A sustained brightening of the chart for Bitcoin is only given when USD 22,435 is recaptured. For this, the trend recovery must be supported by an increasing trading volume, as mentioned several times recently.
- For the time being, the bears continue to hold the scepter in their hands.
Bullish Scenario (BTC)
- The Bitcoin bulls had little to oppose the sell-off up to the cross-support from the downtrend line, the support at USD 18,604 and the derived target of the range break.
- In the short term, the buyer camp must now do everything possible to dynamically heave Bitcoin back above the stall at USD 19,513. The golden pocket of the current movement between USD 19,550 and USD 19,604 runs just above it. Since the EMA50 and the supertrend also act as resistance in this area, recapturing this zone between USD 19,500 and USD 19,726 should be regarded as a Herculean task.
- If the jump back above this resist area succeeds, Bitcoin should immediately attempt to clear the psychologically important $20,000 mark.
- In order to generate fresh upside potential, however, the Bitcoin price must first recapture the resistance at USD 20,478 in order to target the old tear-off edge in the USD 20,779 area.
- If this mark is also pulverized, two further course hurdles await at USD 21,080 with the EMA200 (blue) and the 38 Fibonacci retracement.
- Should the bulls subsequently succeed in recapturing this resistance level without any significant bounces, the recovery should immediately extend towards the turquoise resistance zone between USD 21,691 and USD 21,892.
- The turquoise resistance zone continues to represent a massive hurdle on the way back towards the prices from the previous month.
First directional decision to be expected
- Only if the buyer camp manages to move the Bitcoin price back above the turquoise resistance area at the end of the day with increasing trading volume will the recovery movement continue to gain momentum.
- If Bitcoin then dynamically rises above USD 22,130 towards USD 22,435, the bears will resist again here.
- If the BTC price does not turn significantly south here and can then stabilize above this price level, the next relevant price target is waiting at USD 22,834. Plan to take profits again here.
- The next relevant target marks at USD 23,632 and USD 24,291 are only activated when the Bitcoin price can pulverize the multiple resistance area from the golden pocket of the last downward movement, horizontal resist and 38 Fibonacci retracement of the entire downward movement.
- If the bulls can recapture this resistance level in the coming weeks, the next resistance at USD 24,814 will come into focus. As in August, clear resistance from sellers is to be expected here.
- The 23 Fibonacci retracement of the complete downward movement, which is located here, could not be recaptured in the long term.
- However, this price level must be overcome in the long term in order to release further potential for growth.
- Should the historical high of USD 25,214 be overcome at the end of the day as a result, the next relevant target at USD 26,170 will come into the eyes of investors.
- A preliminary decision for the coming period can be expected at the 61 Fibonacci retracement at USD 26,734.
- For the time being, a price recovery in the direction of USD 28,000 hardly seems possible.
Bearish Scenario (BTC):
- The bears once again showed their strength with the sell-off on Tuesday.
- It went down dynamically to the support at USD 18,604.
- Bitcoin has since recovered somewhat from its monthly low, but so far the sell side has prevented it from recapturing USD 19,513.
- As long as the BTC price cannot reconquer this first price hurdle, another sell-off towards USD 18,950 can be planned at any time. If it falls below it again, Bitcoin should be corrected directly back to its weekly low.
- If the area between USD 18,604 and USD 18,531 is dynamically undercut as a result, the downward movement will extend to the cross support at USD 17,909.
Persistent price weakness makes a relapse to a new annual low likely
- Several support levels should provide support here, at least in the short term. However, whether the bulls can initiate another reversal attempt here will largely depend on new economic data.
- If the buyer side lets the last chance of a course reversal to the north pass, the retest of the annual low at USD 17,567 awaits.
- A break of this last support should increase the selling momentum again.
- As a result, a quick sell-off up to USD 16,180 is conceivable.
- This also increases the probability of a march through to the maximum bearish target range between USD 14,837 and USD 13,858.
Disclaimer: The price estimates presented on this page do not represent buy or sell recommendations. They are merely an assessment by the analyst.
The chart images were created using TradingView created.
USD/EUR exchange rate at the time of going to press: EUR 1.00.
Do you want to buy cryptocurrencies?
Trade the most popular cryptocurrencies like Bitcoin & Ethereum with leverage on Plus500, the leading CFD trading platform. (77% of retail investor accounts lose money with the provider)
To the provider