


Bitcoin (BTC): The buyer side has not yet capitulated
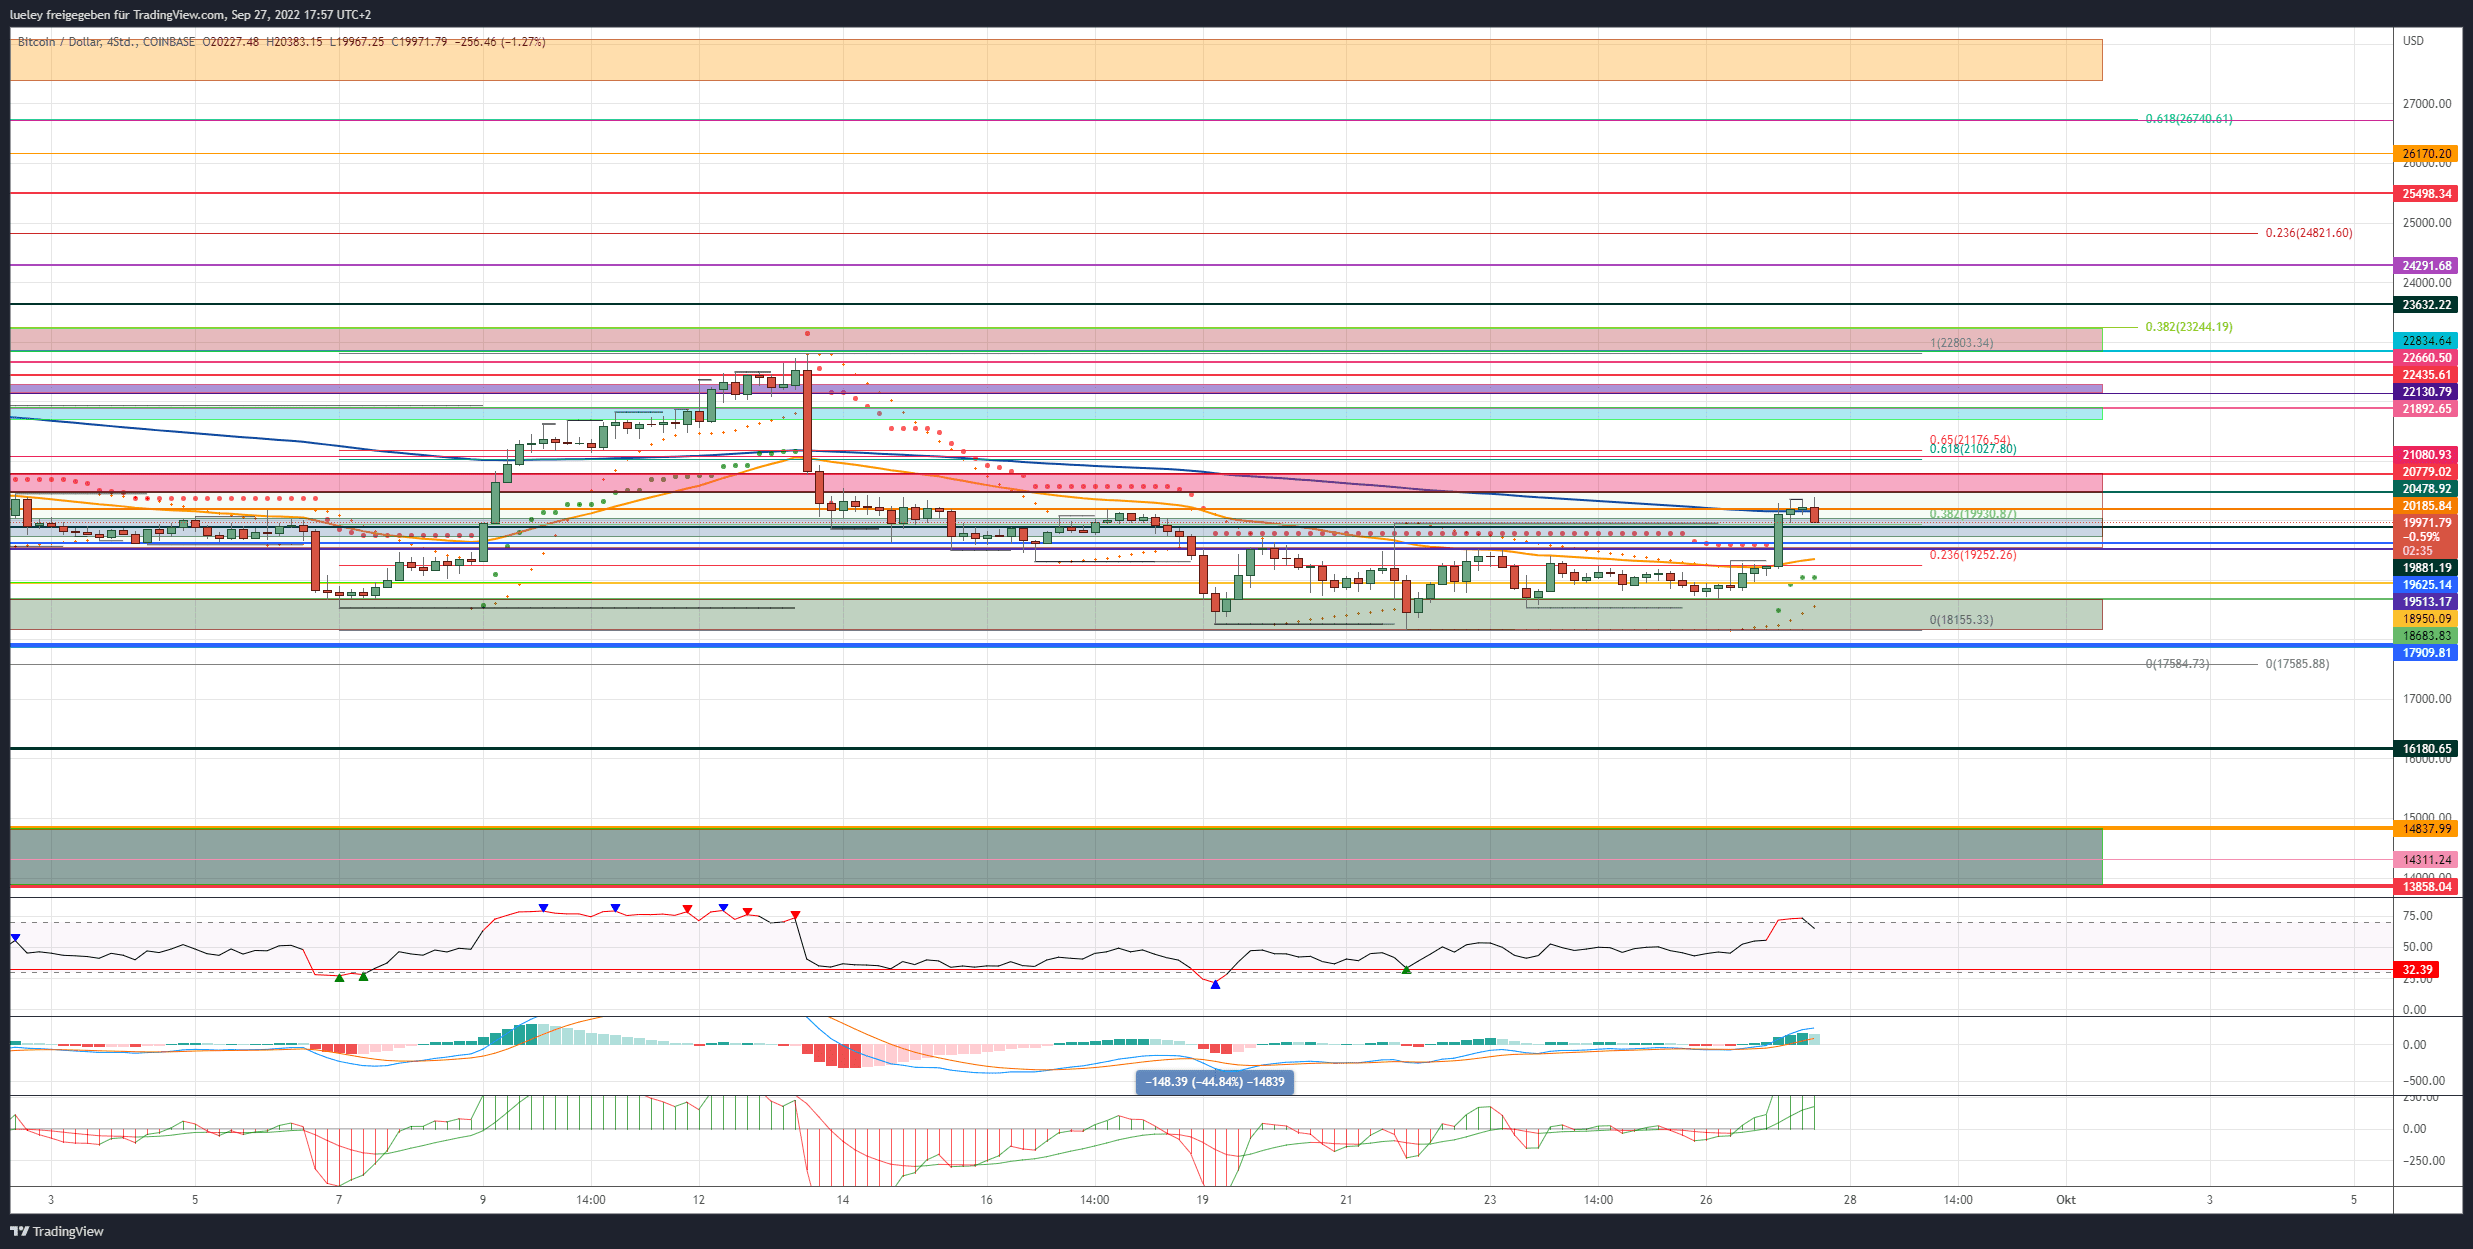
BTC-Kurs: $19,971 (previous week: $18,885)
Short-term resistances/goals: 20.185 USD, 20.478 USD,20.779 USD, 21.080 USD, 21.691/21.892 USD, 22.130 USD, 22.435 USD, 22.834 USD, 23.218 USD,23.632 USD, 24.291 USD, 24.814 USD, 25.498 USD, 26.170 USD, 26.734 USD, 27.696/28.104 USD, 28.607 USD
Short-term supports: 19.881 USD, 19.513 USD, 18.950 USD, 18.683/18.155 USD, 17.909/17.567 USD, 16.180 USD, 14.838 USD, 14.311 USD, 13.858 USD
Recap Bitcoin
- Bitcoin initially slipped significantly south as a result of the interest rate hike by the US Federal Reserve last week.
- Starting from the daily high last Wednesday at USD 19,950, the Bitcoin price fell almost 10 percentage points to USD 18,155 within 48 hours of trading.
- Over the weekend, the BTC price stabilized and subsequently trended sideways in a trading range of six percentage points before a dynamic breakout took the Bitcoin price to the EMA200 (blue) on the 4-hour chart at $20,160 this Tuesday morning.
- The key crypto currency is currently trying to stabilize above this floating resistance.
Bitcoin: Course again follows the movements on the US stock market
- Bitcoin follows the recovery on the classic stock market. The fact that the US dollar index was also able to work through an important price target yesterday Monday and subsequently started a course consolidation is also to be seen as positive.
- Despite this important partial success, investors should keep the announcement of new inflation figures at the end of the week in mind. As always, you can read in the current overview article which dates are likely to be relevant for the price of Bitcoin.
- In addition, it is still important to keep an eye on the Nasdaq100 and the S&P500. Both indices are currently trading not far from their lows for the year and are likely to correct south again if these supports are abandoned. This should not go unnoticed in the crypto sector either.
- In the event of a possible follow-up increase in the coming trading days, investors should continue to look at the trading volume. If the Bitcoin price rises north, but the trading volume does not increase, the recovery is on shaky ground and could lead to another sell-off at any time.
- The fact that the Bitcoin dominance was able to recover recently and is about to break out of the highs from September at 41.50 percent is a possible indication of increased investment by investors in the crypto currency.
A look at the indicators
- The Fear and Greed Index is trading back in the “extreme fear” zone at 20, which is positive given the relative strength over the past two trading days.
- Looking at the RSI and MACD indicators, the 4-hour chart shows the first overbought states. In the daily chart, both indicators have now been able to generate a long signal again. Both the RSI and the MACD indicator still have room to rise here, which supports the bullish perspective in the short term.
- The buyer side must do everything in the short term to ideally stabilize Bitcoin above USD 19,881. At best, a brief fall back to USD 19,513 would still be manageable.
- A slight brightening of the chart for Bitcoin is only to be expected when it stabilizes above the red resistance zone between USD 20,478 and USD 20,779. The crypto reserve currency could then extend its recovery movement to the golden pocket at USD 21,080. If this resistance level is also recaptured, the upward movement will expand towards USD 21,892.
Bullish Scenario (BTC)
- After a bearish previous week, in which the Bitcoin price was able to hold its own relatively well despite a massive sell-off on the classic stock market, the Bitcoin bulls are currently attacking again and are trying to recapture the EMA200 this Tuesday.
- Optimally, the bulls are now stabilizing BTC price above USD 19,881 and then clearing the cross-resistance in the USD 20,185 area.
- Then the buyer camp must do everything possible to heave Bitcoin back above the red resistance area in a timely manner.
- In order to confirm the upward movement, Bitcoin must then also recapture the zone around USD 20,800 in order to recapture the EMA50 in the daily chart. Not an easy task in view of the bearish chart picture in the US stock indices.
- Should the jump back above these two resist areas succeed, the bulls must not let up and must immediately try to move Bitcoin above USD 21,080. The golden pocket of the current trend movement runs between USD 21,027 and USD 21,176.
Bitcoin course: “Golden Pocket” crucial
- If this area is also overcome without significant price corrections, investors will focus again on the turquoise resistance zone between USD 21,691 and USD 21,892.
- Only if the buyer camp manages to stabilize the Bitcoin price above the turquoise resistance zone with increasing trading volume does the probability of a subsequent movement in the direction of the purple resistance area increase.
- If Bitcoin can then dynamically break through USD 22,130 and the resistance at USD 22,435, a directional decision should be planned at USD 22,834 at the latest.
- Only when the Bitcoin price can pulverize the multiple resistance area of horizontal resist and 38 Fibonacci retracement of the entire downward path at USD 23,244 will new price targets at USD 23,632 and especially USD 24,291 come into focus.
- Should the buyer camp also be able to dynamically break through this resistance level in the coming weeks, the recovery will extend to USD 24,814. As in August, clear resistance from sellers is to be expected here.
- The 23 Fibonacci retracement of the complete downward movement, which is located here, could not be recaptured in the long term.
- However, this strong resistance must be breached in the long term in order to release further upside potential.
- If Bitcoin then also overcomes the historical high of USD 25,214 at the daily closing price, a march through to USD 26,170 cannot be ruled out.
- A preliminary decision for the coming period is still to be planned at the 61 Fibonacci retracement at USD 26,734.
- Only when this strong resistance level can also be overcome will there be room for a jump towards USD 28,000.
Bearish Scenario (BTC)
- The bears were once again unable to take advantage of the price weakness in the previous week. Once again, the seller camp failed in their attempt to push the BTC price back towards the yearly low.
- The seller side is currently trying to cap the BTC price below USD 20,779. However, a course reversal at the current price level in the area of the EMA200 would be even better.
- If the seller succeeds in pushing the Bitcoin price back below the support mark at USD 19,881, there will be another short-term directional decision at USD 19,513.
- If the BTC price gives up this important support level, the 23 Fibonacci retracement at USD 19,252 will come into focus. In this area, Bitcoin started its current upward movement.
- A abandonment of this support is likely to see Bitcoin correcting above $18,950 back into the green support zone between $18,683 and $15,155.
- Once again, the bulls will do everything they can to stabilize the BTC price again.
- If, on the other hand, Bitcoin slips below this support zone and USD 17,909 does not provide any support either, a retest of the annual low at USD 17,567 should be planned.
- If, in the course of a sustained sell-off on the stock markets, Bitcoin also breaks the year’s low, the price correction extends without detours to USD 16,180.
- The probability of a correction up to the repeatedly mentioned bearish target zone between USD 14,837 and USD 13,858 then also increases significantly.
Disclaimer: The price estimates presented on this page do not represent buy or sell recommendations. They are merely an assessment by the analyst.
The chart images were created using TradingView created.
USD/EUR exchange rate at the time of going to press: EUR 1.03.
Do you want to buy cryptocurrencies?
Trade the most popular cryptocurrencies like Bitcoin and Ethereum with leverage on dYdX, the leading decentralized exchange for derivatives trading.
To the provider
Related posts:
 What is Golem (GNT) – Comprehensive Beginner’s Guide
  Overview of Hive OS: How To Make Money 2021 | Features| Setting Up| Installation
  Security Token Offering – The Future Of Coins In Europe
  Utopia: A self-Contained Cryptocurrency Ecosystem
  Cryptocurrency Mining Farm – Setup (DIY) and Configuration
  Cryptocurrency Cloud Mining – Best Services (Pros and Cons + Scams) 2019


