


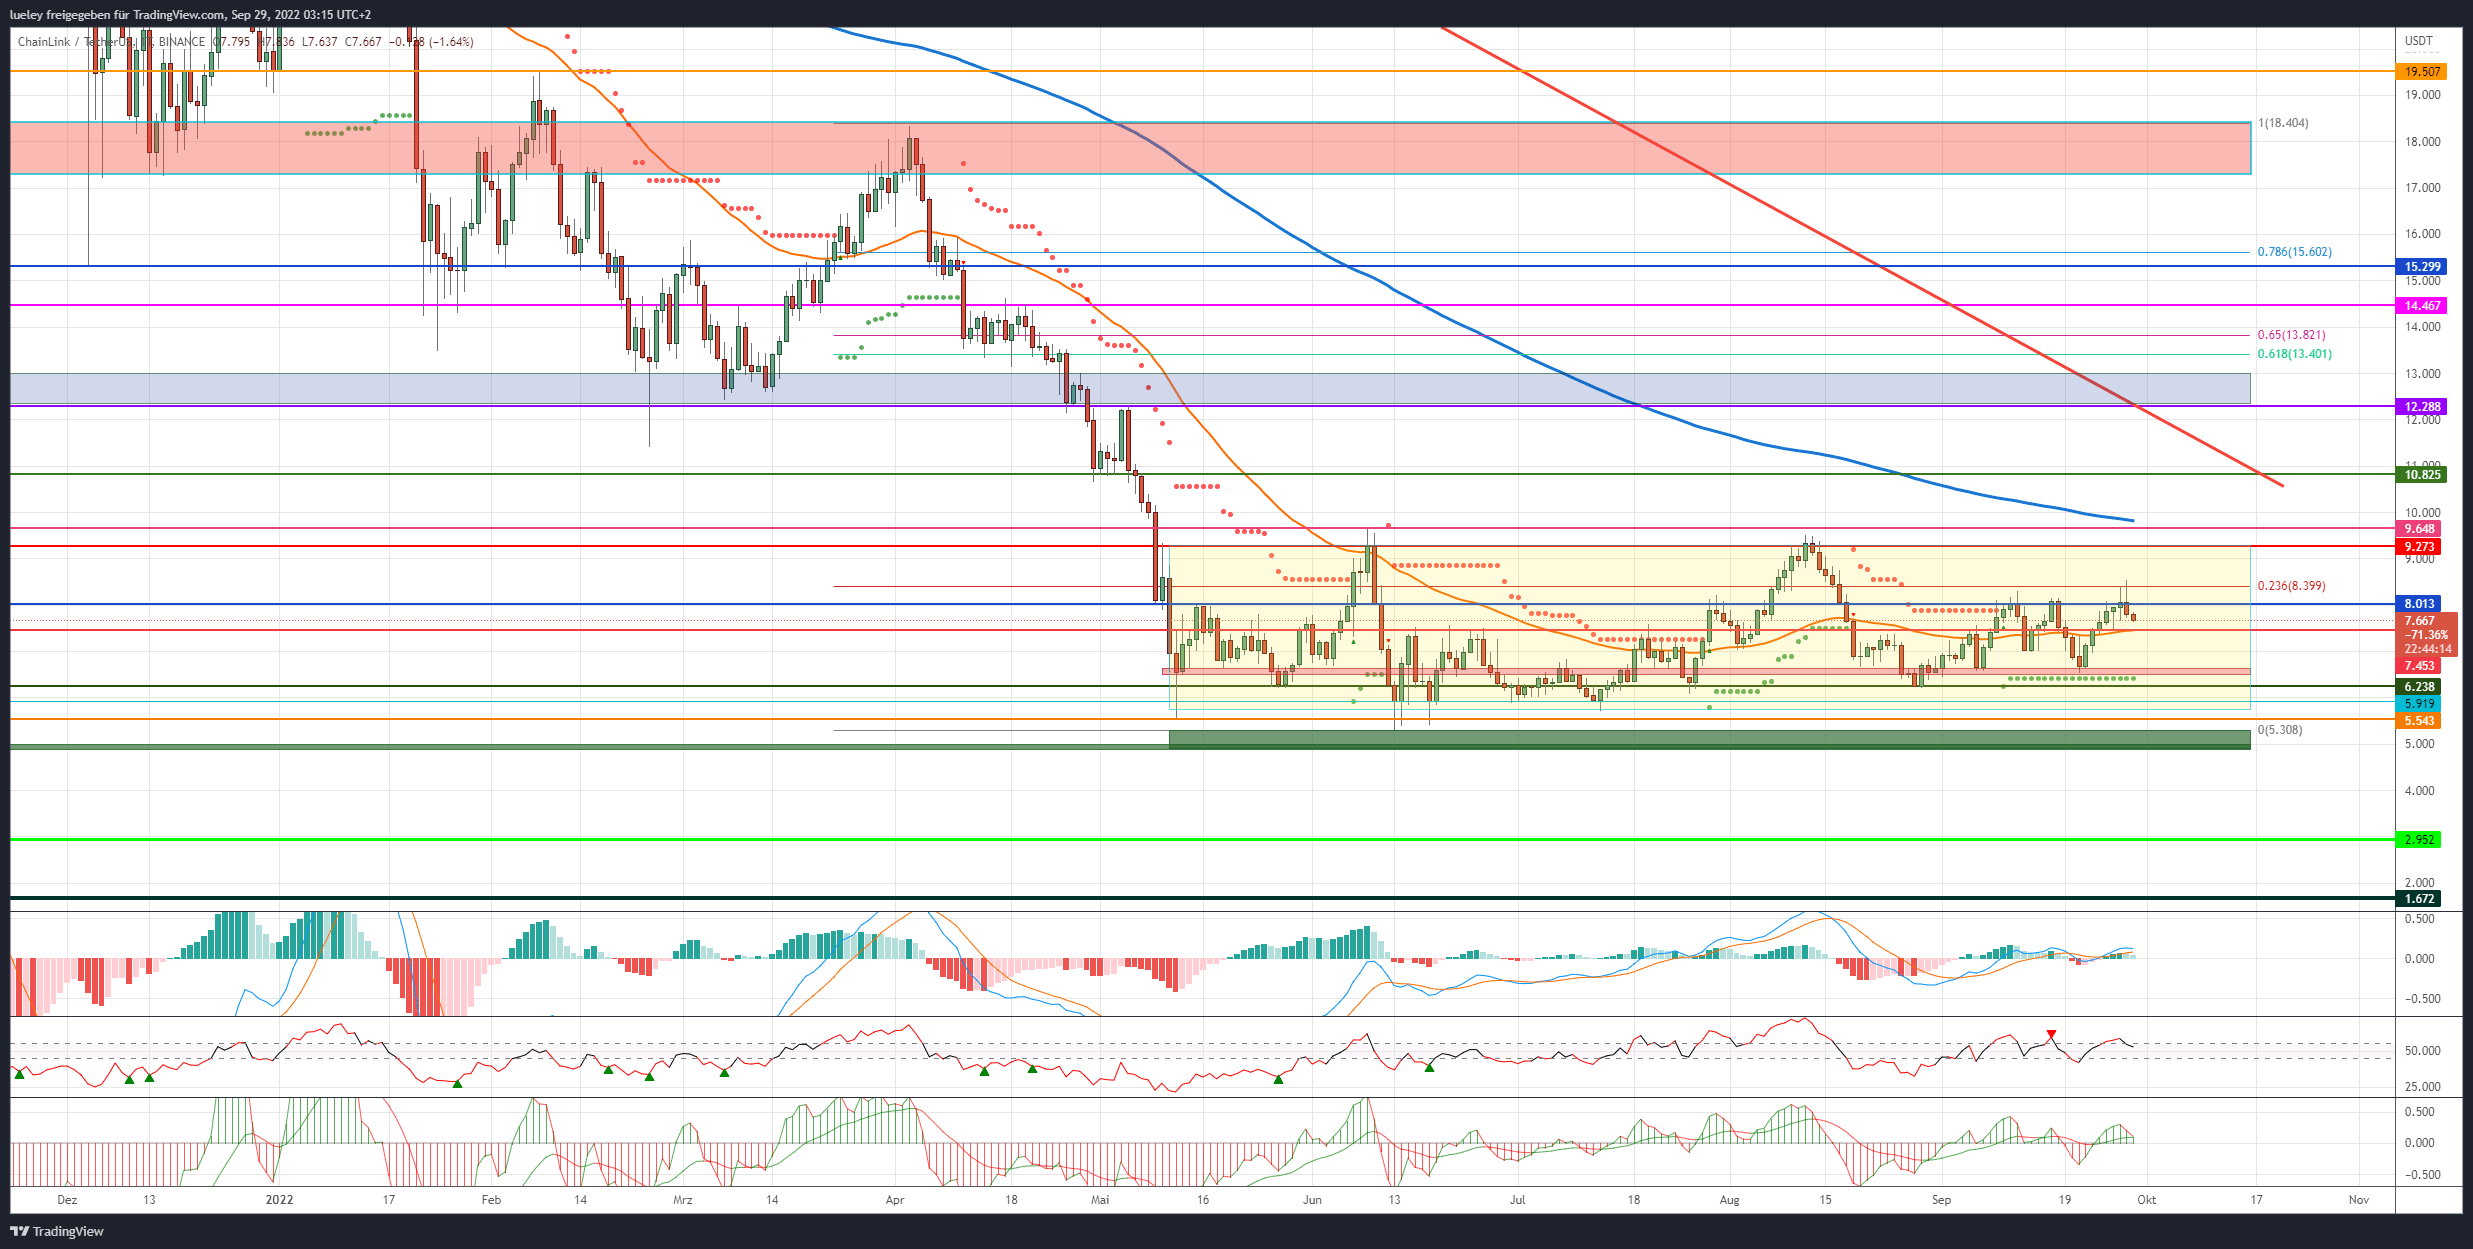
- Course (LINK): $7.70 (previous week: $7.12)
- Resistances/goals: 8,01 USD, 8,39 USD, 9,27/9,64 USD, 10,83 USD, 12,36 USD, 13,40/13,80 USD, 14,47 USD, 15,30 USD, 17,29 USD, 18,10 USD, 19,50 USD, 21,96 USD, 25,81/26,86 USD
- Supports: 7,45 USD, 6,60 USD, 6,23 USD 5,54 USD, 5,30 USD, 4,90 USD, 2,95 USD, 1,67 USD
Chainlink Recap
- After the LINK price had bounced off the red support area at USD 6.60 in the previous week, there was a noticeable recovery in the last few trading days. With a 20 percent price increase in a weekly comparison, Chainlink is currently one of the outperformers on the market.
- One of the reasons for the price increase in the last few days seems to be the announcement of the staking option at Chainlink, which is now scheduled for December. In the course of the so-called Chainlink Economics 2.0 In addition to rewards for staking, the developers plan to create further incentives for developers and service providers.
- Cross-chain interoperability is also high on the list of planned improvements.
- The team announced at the same time a project partnership with SWIFT, the global telecommunications network for banks.
- Despite consistent further developments, the first investors used the rise up to the 23 Fibonacci retracement at USD 8.39 to take profits. The Chainlink course also seems to experience a “sell the news” effect in the short term.
- Overall, Chainlink has remained unchanged in a sideways range between USD 9.30 and USD 5.90 since June.
- Recently, however, the LINK price had consistently been able to form higher lows and should aim for the upper edge of the range at USD 9.27 if it jumps above yesterday’s daily high of USD 8.54.
- With a view to the indicators, the daily chart paints a slightly positive picture. The RSI indicator as well as the MACD still show weak buy signals.
- Investors only have to worry about a daily close below USD 6.22. In this area, Chainlink is technically well supported.
Bullishe Variante (Chainlink)
- The LINK price must try to defend the cross-support from the horizontal support line and EMA50 (orange) at USD 7.45 in the short term.
- If Chainlink picks up momentum here again and overcomes the USD 8.01 mark at the end of the day, a subsequent increase in the direction of the upper edge of the trend channel at USD 9.27 is likely.
- A preliminary decision can be expected between USD 9.27 and USD 9.64. In addition to the horizontal resistance marks, derived from the highs from June and August of this year, the EMA200 (blue) is also not far from this resist zone.
- In the first attempt, Chainlink should bounce off here. If a dynamic breakout above this cross-resistance is successful, the area around USD 10.82 automatically comes into focus.
- If this resistance can also be pulverized as a result, the view should be directed towards USD 12.28.
- This price level has acted as resistance multiple times in the past, so a direct recapture will require massive buying power by the bulls. Furthermore, the overriding downtrend line, coming from the all-time high, can be found in this area.
- If Chainlink can stabilize above the resistance line and the resist at USD 10.83 despite increased profit-taking and also overcome USD 12.28 in the medium term, the recovery movement will expand in the direction of the golden pocket between USD 13.40 and USD 13.80. At this important resistance, the first investors will realize profits again.
- If the buyer side succeeds in dynamically breaking through this resist mark as well, the next area of increase between USD 14.47 and USD 15.30 will be activated. In addition to the lows of May and June 2021, this zone also acted as an important chart area at the beginning of the year. Accordingly, a massive resistance is now waiting here.
The upward movement is gaining momentum
- If the overall market also stabilizes and the innovations in Chainlink’s ecosystem meet with a positive response in the community, the LINK course could start in the red resistance area. Here are the historical highs from February and April 2022 in the range between USD 17.29 and USD 18.10.
- In particular, the upper edge at USD 18.10 should be given more attention. The 38 Fibonacci retracement of the complete downward trend movement also runs here. A break above this resistance is likely to provide further upside momentum for LINK price.
- Chainlink should then jump to at least USD 19.50. Chainlink last failed at this mark on February 8, 2022. For now, this resistance again represents the maximum price target in the current bear market.
- Only when the psychologically important USD 20 mark is recaptured could the LINK price target the long-term price target in the form of the Golden Pocket between USD 25.81 and USD 26.86.
Bearishe Variante (Chainlink)
- The bears have attempted to initiate a countermove to the south for the past 24 hours of trading. The LINK price closed below USD 8.01 the day before and could be put to the test at USD 7.45.
- If the seller can sustainably push the Chainlink price below the EMA50 running here, this would be a first bearish indication.
- The bears should then target the red support area at USD 6.60 again.
- The combination of horizontal support and supertrend will be hard to break on the first try.
- However, if the key crypto currency Bitcoin (BTC) weakens again in the coming trading days and corrects back towards its annual low, a retest of the green support zone is also conceivable for Chainlink. If the USD 5.54 mark is broken, a preliminary decision will be made at the year’s low of USD 5.30.
- If Chainlink does not stabilize at this support mark and falls below the year-low at the daily closing price, the correction movement should extend immediately to the breakout level from June 2020 at USD 4.90.
Another course correction is imminent
- If there is no strong countermovement in the area of USD 5.00 and Chainlink sustainably breaks through this support mark to the south, the correction movement could accelerate significantly. A fall back up to USD 2.95 can then be planned for at any time.
- Should the overall market also fall further south in the coming months and Bitcoin correct towards USD 13,500, a price slide up to the maximum bearish price target of USD 1.67 cannot be completely ruled out.
- However, as long as Chainlink can sustain above $5.00, a sell-off down to these 2019 support levels is unlikely.
Disclaimer: The price estimates presented on this page do not represent buy or sell recommendations. They are merely an assessment by the analyst.
The chart images were created using TradingView created.
USD/EUR exchange rate at the time of going to press: EUR 1.03.
Do you want to buy cryptocurrencies?
Trade the most popular cryptocurrencies like Bitcoin and Ethereum with leverage on dYdX, the leading decentralized exchange for derivatives trading.
To the provider
Related posts:
 What is Golem (GNT) – Comprehensive Beginner’s Guide
  Overview of Hive OS: How To Make Money 2021 | Features| Setting Up| Installation
  Security Token Offering – The Future Of Coins In Europe
  Utopia: A self-Contained Cryptocurrency Ecosystem
  Cryptocurrency Mining Farm – Setup (DIY) and Configuration
  Cryptocurrency Cloud Mining – Best Services (Pros and Cons + Scams) 2019


