


Bitcoin (BTC): Renewed price weakness is emerging
BTC-Kurs: $21,725 (previous week: $21,725)
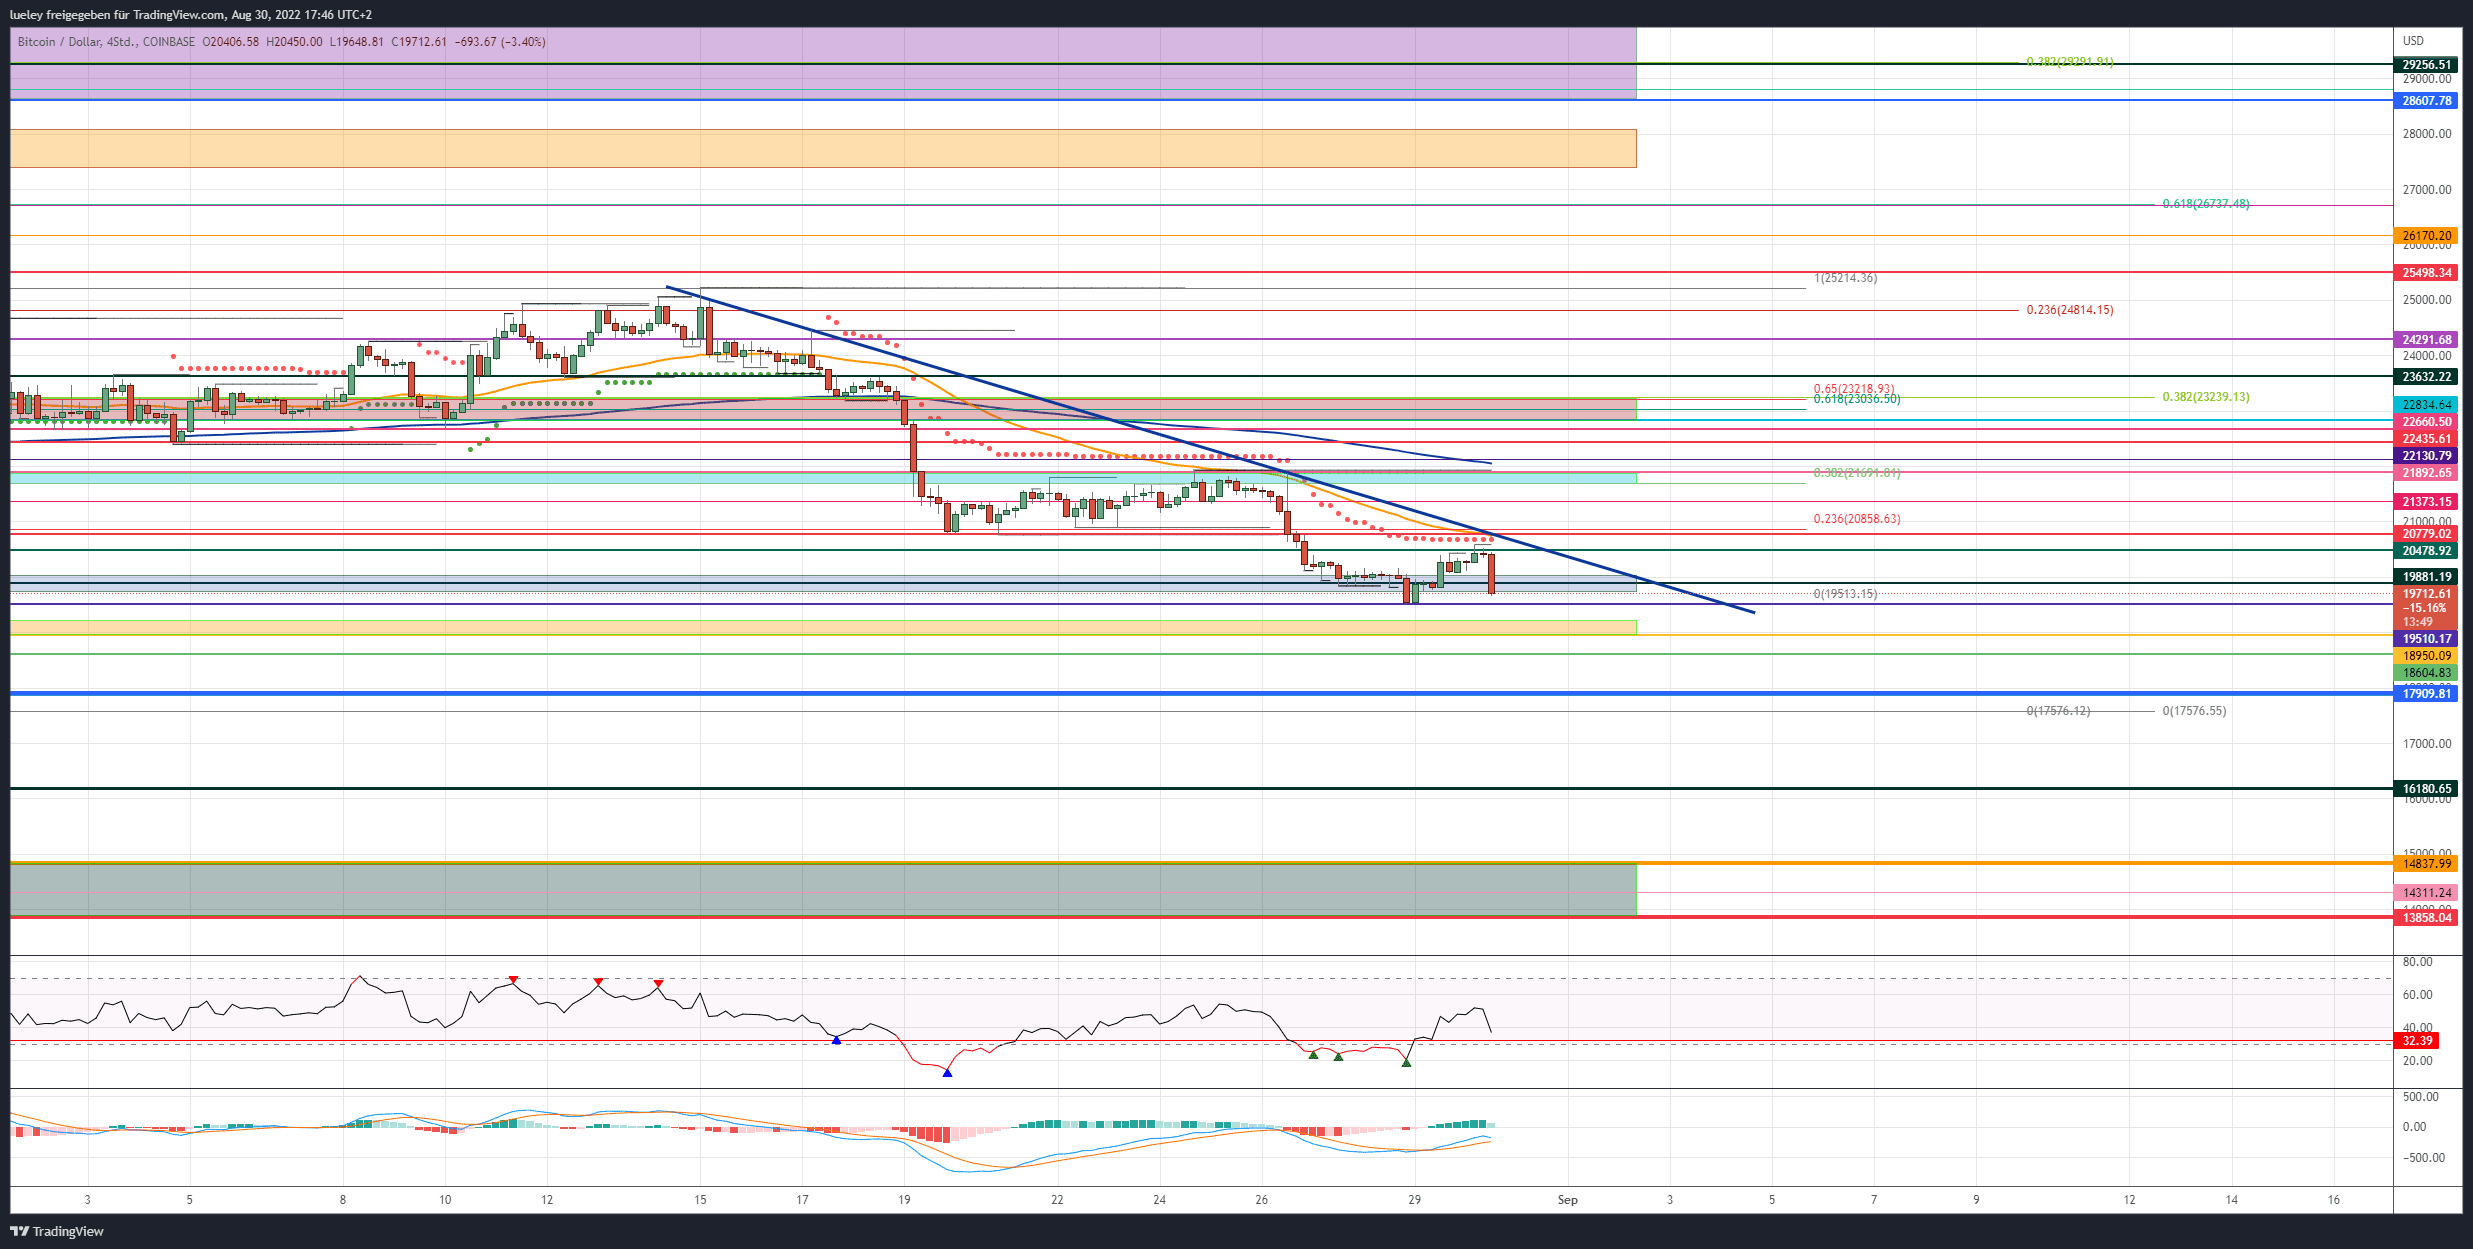
Short-term resistances/goals: 20.478 USD, 20.779 USD, 21.373 USD, 21.691/21.892 USD, 22.130 USD, 22.435 USD, 22.834 USD, 23.218 USD,23.632 USD, 24.291 USD, 24.816 USD, 25.498 USD, 26.170 USD, 26.734 USD, 27.696/28.104 USD, 28.607 USD, 29.256 USD, 29.975 USD
Short-term supports: 19.881/19.720 USD, 19.513 USD, 19.212/18.950 USD, 18.604 USD, 17.909/17.567 USD, 16.180 USD, 14.838 USD, 14.311 USD, 13.858 USD
Recap Bitcoin
- As a result of the sell-off on the classic stock market last Friday, the price of the key crypto currency slipped briefly below the 2017 all-time high of USD 19,881 at the end of the week. At its peak, the Bitcoin price corrected to USD 19,513 before the bulls were able to stabilize the price.
- Drastic statements by US Federal Reserve Chairman Jerome Powell about the Fed’s interest rate policy in the coming months had initially led to drastic sell-offs on global stock indices. Within a few hours, around 2 trillion US dollars in market capitalization was wiped out in the major stock markets.
- The US dollar index DXY then rose to a new 20-year high. The ongoing strength of the dollar has had an increasingly negative effect on the price developments of the US stock indices and the crypto market in the last few months of trading.
- According to COINMETRICS, the correlation between the world’s largest stock index, the S&P500, and the key cryptocurrency has recently increased significantly and is currently at an annual high of almost 0.7.
- Yesterday, Monday, August 29, the BTC price initially recovered back above USD 20,000 and was able to close the future price gap (CME gap) at USD 20,470 that developed over the weekend this Tuesday morning, but so far it has been enough for more Not.
- In the last few minutes of trading, Bitcoin shows renewed weakness, slipping back below the $20,000s after the release of a better-than-expected US Consumer Confidence along with a sharply falling Nasdaq100.
These price markers become relevant
- As long as the BTC price cannot sustainably rise back above the resistance at USD 20,478, the price recovery can only be regarded as a technical recovery.
- If BTC overcomes this area, the next relevant resist is already waiting at USD 20,779. This is the trailing edge of the August 26 sell-off.
- If a breakout above the multiple resist in the area of USD 20,800 is successful, the gaze should be directed towards the turquoise zone between USD 21,691 and USD 21,892 in the short term.
- On the other hand, another drop below the historical low of USD 19,513 should lead to a directional decision at USD 18,950. A dynamic break below this key support would result in an instant retracement to the year low area of $17,909 to $17,567.
- An increase in volatility can be expected by the end of the week at the latest. On Friday, the NFP jobs report will be released in the US. You can read in the current overview article which other economic data are likely to be relevant for the price development this week.
- The renewed price weakness in the last few trading days capped the Fear and Greed Index in the “fear area” at currently 27. For the time being, however, the fear barometer seems to be leveling off in the zone between 25 and 30. It remains to be seen whether continued price consolidation will cause the index to correct back into extreme fear territory.
That’s what the indicators say
- After the RSI fell back into the oversold area at the end of the week on Sunday, the RSI in the 4-hour chart is currently showing a sell-signal again. On the other hand, the MACD indicator still has an active buy signal, but threatens to turn it into a new sell signal in the near future.
- In the daily chart, both indicators continue to show sell signals. However, a bullish price divergence formed in both timeframes over the weekend.
- This disparity between higher lows in the indicator and lower lows in the price chart caused courageous investors to invest more in Bitcoin again at the beginning of the week.
- Looking at the weekly chart, the RSI is trending below the neutral zone between 45 and 55 with a value of 35 and has not yet provided a sustainable signal. On the other hand, the MACD still has an active long signal. Overall, the indicators therefore have a supportive effect on the Bitcoin price.
Bullish Scenario (BTC)
- The Bitcoin bulls were able to prevent the total crash for the time being. In the short term, the buyer camp must now form a higher low in the USD 19,726 area. At most, a short spike at the weekly low would still be manageable.
- In order to generate further upside potential, however, it is first necessary to break through the resistance at USD 20,478 in order to rise again to the demolition edge in the USD 20,779 area.
- Here, with the Supertrend, the EMA50 (orange), the price-limiting downward trend line and the 23 Fibonacci retracement of the current price movement, there is a whole bundle of price hurdles.
- If the bulls manage to reclaim this very strong resistance area in the coming days, a follow-up rise above USD 21,373 towards the highs of the previous week can be expected.
- The turquoise resistance zone represents a real test.
- Only if the buyer camp manages to heave the Bitcoin price back above the turquoise resistance area at the end of the day with increasing trading volume will there be further price potential north.
- If Bitcoin rises back above USD 22,130 in the direction of USD 22,435, resistance from the bear camp is to be planned again at this price mark.
- If the BTC price does not ricochet southwards and can then stabilize above this price level, the next relevant price target is waiting at USD 22,834. Investors will realize more profits here.
First directional decision to be expected
- Only when the Bitcoin price estimates itself above USD 22,834 again will there be a preliminary decision in the USD 23,238 area. In addition to the higher-level 38 Fibonacci retracement, the golden pocket of the last price movement also runs here.
- This area represents the maximum price target for the coming trading days.
- Only a dynamic recapture would enable the march through to USD 24,291.
- If this resistance level can also be recaptured in the coming weeks, massive resistance from the bears can be expected in the zone around USD 24,816 at the latest.
- Here is the 23 Fibonacci retracement of the full down move. Any escape attempts have been abruptly halted here in recent weeks.
- However, this price level must be overcome in the long term in order to release further potential for growth.
Bulls need to confirm the sustainability of the trend move with more bitcoin buying
- Only when the historical high of USD 25,214 at the daily closing price is overcome will there be further price potential for Bitcoin.
- The $26,170 mark in particular represents an important target zone.
- A preliminary decision for the coming period can be expected at the 61 Fibonacci retracement at USD 26,734.
- If the buyer side stabilizes the Bitcoin price above this price level, the initially maximum target range between USD 27,696 and USD 28,104 comes into view.
- From the current chart view, a march back over USD 30,000 is not to be expected, the trading volume for Bitcoin is currently too low.
Bearish Scenario (BTC):
- The bears are still not letting up and are using every price weakness in the US stock indices to sell off.
- In the last hour of trading alone, the sell-side liquidated around $20 million in leveraged long positions.
- As long as the BTC price remains capped below USD 20,779 in the coming trading days, a retest of the historical low at USD 19,510 can be expected at any time. If this support is broken, the correction will immediately widen towards the yellow support zone at $19,000.
Looking towards new annual lows
- If the BTC price does not stabilize here and the support at USD 18,950 is also breached, the probability of a relapse to the yearly low increases significantly.
- Although there is further support at USD 18,604 and USD 17,909, whether the bulls initiate another reversal attempt will largely depend on the economic data in the coming trading days.
- If the buyer side lets the last chance of a course reversal to the north pass, the retest of the annual low at USD 17,567 awaits.
- A break of this last support seems increasingly likely and should increase the selling momentum once more.
- As a result, a quick sell-off up to USD 16,180 is conceivable.
- This also increases the probability of a march through to the maximum bearish target range between USD 14,837 and USD 13,858.
Disclaimer: The price estimates presented on this page do not represent buy or sell recommendations. They are merely an assessment by the analyst.
The chart images were created using TradingView created.
USD/EUR exchange rate at the time of going to press: EUR 1.00.
Do you want to buy cryptocurrencies?
eToro offers investors, from beginners to experts, a comprehensive crypto trading experience on a powerful yet easy-to-use platform. We took a close look at eToro.
To the eToro review
Related posts:
 What is Golem (GNT) – Comprehensive Beginner’s Guide
  Overview of Hive OS: How To Make Money 2021 | Features| Setting Up| Installation
  Security Token Offering – The Future Of Coins In Europe
  Utopia: A self-Contained Cryptocurrency Ecosystem
  Cryptocurrency Mining Farm – Setup (DIY) and Configuration
  Cryptocurrency Cloud Mining – Best Services (Pros and Cons + Scams) 2019


