


Today we bring you the answer to the age-old question, i.e. what is the best time to buy Bitcoin and why Bitcoin Rainbow Charts are the best indicators.
The price of Bitcoin has been the greatest catalyst that has brought millions of people into the world of cryptocurrencies. Launched in 2009, after the paper was published by the mysterious entity Satoshi Nakamoto, the price of Bitcoin only labored to around USD 1000 by 2016. Bitcoin and cryptocurrencies were considered only as something that “tech geeks” and “nerds” dealt in.
But something changed in 2017; the prices of Bitcoin soared above USD 10000 and the world started taking notice. This has led to what we are witnessing in the form of a new financial revolution where people are taking control of their lives and attaining financial freedom through BTC and thousands of other cryptocurrencies.
So, if you wish to do the same and want to know what is the best time to buy Bitcoin, then you have come to the right place. We will tell you all about it and how you can use the Bitcoin Rainbow Charts to your advantage.
What Is A Bitcoin Rainbow Chart
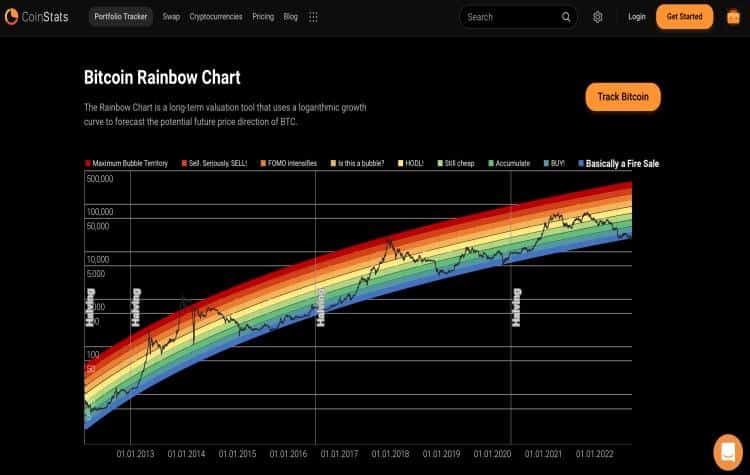
Bitcoin Rainbow Chart at CoinStats
When we think of a rainbow, our mind automatically wanders to a soothing and marvelous array of colors arranged in the sky on a sunny day. It brings a smile to our faces and almost always has some happy memories associated with it. The Bitcoin rainbow chart is also something like that, but instead of being a natural phenomenon, it is something that has historically brought us the best news about the price action of BTC.
While a rainbow in general has only seven colors, the Bitcoin rainbow charts have more than seven. So to understand them in simple words, Bitcoin rainbow charts are a sort of technical indicator that uses mathematical models to chart and give an insight into the price of Bitcoin historically. It uses logarithmic regression to chart the price movements of Bitcoin historically, and also gives us some idea about what the next move could be.
If you do not understand what a logarithmic regression model is, don’t worry about it. You just need to know how to read the Bitcoin rainbow charts and use that information to make trading decisions. It should be kept in mind that Bitcoin rainbow charts are not to be used to calculate or speculate the day-to-day price movements of BTC. Instead, Bitcoin rainbow charts are used to study and predict long-term price action. This indicator becomes so important while looking at the BTC price because, in its entire history, the BTC price has stayed between the color bands of the rainbow chart’s logarithmic regression.
How To Read Bitcoin Rainbow Charts
While no indicator, chart, or analysis about a highly volatile and new asset like Bitcoin can be considered fool-proof and definite, there is merit in trying to read the Bitcoin rainbow charts. The price has historically stayed within the bounds of the rainbow charts and planning out your investment and buying strategy around it can be one of the best decisions. It should however be kept in mind that this is not investment advice and is only meant for educational purposes.
The Bitcoin rainbow charts have nine colors ranging from dark red to dark blue. Dark red is the color that represents the top for BTC price and dark blue represents the bottom for BTC price. Whenever the price goes to the dark red regions, it almost always falls and goes to the lower levels, and when it goes to the dark blue band, it almost always bounces up from there. The actual color bands and what they signify can be seen down below in the Bitcoin rainbow chart from CoinStats.
When Is The Best Time To Buy Bitcoin
Now that we understand rainbow charts and how to use them to our advantage, the answer to the question, when is the best time to buy Bitcoin, is simple. Whenever the price goes into the blue zones, it would be the perfect time to either start buying or dollar cost averaging your Bitcoin holdings as these are the times of total bearish sentiment in the crypto markets. Similarly, the best time to start taking profits is when the price reaches the red bands. Because unless you take profits in crypto, you are not going to make any money.
Final Word
While no one knows for sure and no mathematical model can ever predict what is going to happen in the future, there are indicators and signs that can be used to make your investment journey smoother and profitable. Bitcoin rainbow charts are one of those tools at your disposal that can help you determine when is the best time to buy Bitcoin. Although, the crypto market is highly volatile and nothing in this article is a piece of investment advice.
Related posts:
 What is Golem (GNT) – Comprehensive Beginner’s Guide
  Overview of Hive OS: How To Make Money 2021 | Features| Setting Up| Installation
  Security Token Offering – The Future Of Coins In Europe
  Utopia: A self-Contained Cryptocurrency Ecosystem
  Cryptocurrency Mining Farm – Setup (DIY) and Configuration
  Cryptocurrency Cloud Mining – Best Services (Pros and Cons + Scams) 2019


