


On Wednesday the bitcoin rate suddenly rose by 15 percent! The question then always remains: could you have seen it coming? The answer is yes. But that is always afterwards.
In this analysis we also look at bitcoin and energy costs. Can you predict the rate by calculating the energy costs of bitcoin mining?
Looking back: why did the bitcoin rate rise?
But first a look back. You could have seen the movement rising upwards on the basis of divergence. In most cases this is a precursor to an increase. Divergence means that the price drops lower. At the same time, indicators are on the rise. In the graph below we have taken the RSI and the MACD as an example.
The bitcoin price movement of last week is somewhat reminiscent of the end of October. Then too, the price fell and the values of indicators rose. At the end of October, bitcoin flew up like a rocket, the course has not reached that far yet. But if you look at the RSI, the bitcoin price still has enough room to rise.
The RSI is still in the purple band and is by no means overbought. The bitcoin rate can therefore be raised somewhat within a few days.
Bitcoin course breaks out of trend line, we can look up again
The bitcoin course shot up on Wednesday. This movement has broken bitcoin from an important trend line. You can see that on the graph below.
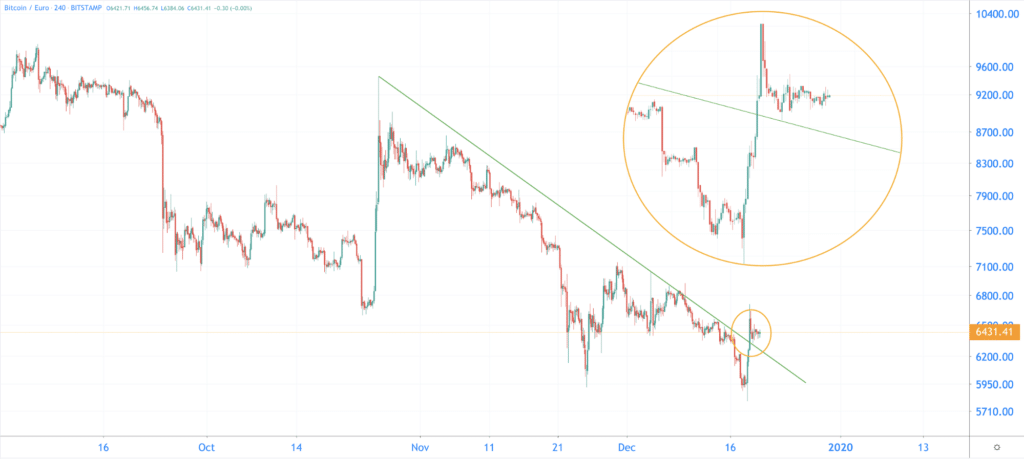
Such an increase is often accompanied by a correction, and that was also the case this time. Bitcoin fell by five percent, but is now moving sideways again. It is also positive that the course finds support on the trend line. That gives the course a solid foundation for further growth.
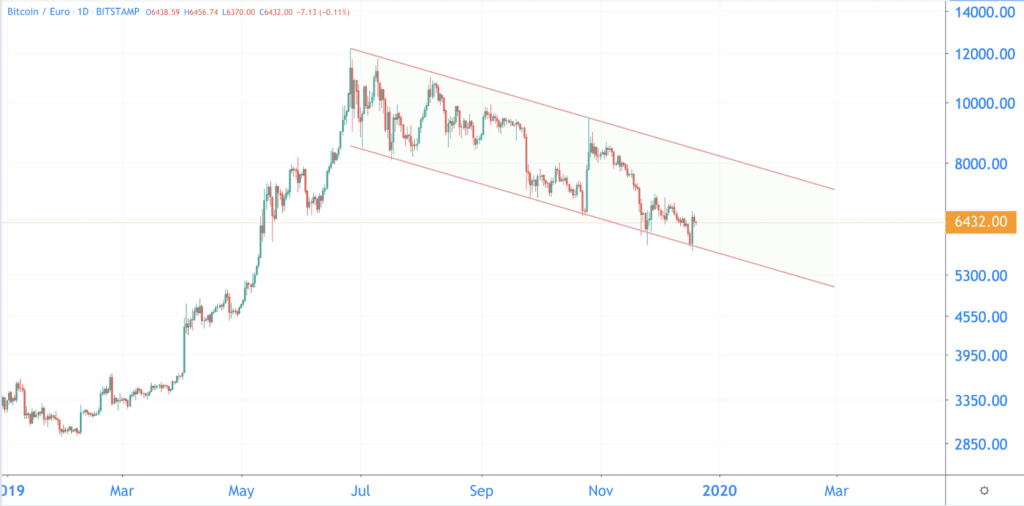
But course is still in a falling channel
We have to be objective, in the long term the course is still caught between two falling trend lines. You also call that a channel.
Bitcoin occasionally makes large movements, such as the end of October and last week. Nevertheless, the bottoms of the course are always slightly lower. So as long as the price does not break out of the channel, we are still talking about a falling trend.
It would only be really bullish if bitcoin makes a convincing move up to 8,100 euros. That is namely the top of the channel. Perhaps a good intention for bitcoin in 2020 ?
Can you predict the bitcoin rate with energy costs?
The price of bitcoin does not only consist of buyers and sellers. Bitcoin miners also influence the price. Last Tuesday we wrote that miners can influence the price by selling bitcoin. Now we will take a closer look at the costs incurred by miners.
Miners maintain the bitcoin network. That gives bitcoin safety. If you want to attack the bitcoin blockchain, you must have more than half the computing power of all computers on the network. And that is now almost impossible.
These computers naturally use energy. And energy costs money. You can see this as the underlying value of bitcoin. The value of bitcoin is not based on anything, but on devices that run day and night.
Charles Edwards of Capriole Investments devised a way to express this value in dollars. He calls this the energy value of bitcoin. Or in other words: how many dollars does it cost on average to mine a bitcoin?
He uses this formula for this:
- Multiply the computing power of the network (in gigahashes) by the energy required for this (joule per gigahash).
- Divide that by the growth in the bitcoin range.
- You then multiply that by the energy costs in dollars per joule.
The line that you see below is the ratio of the bitcoin price to the energy value. The zero is exactly the energy value. And a hundred percent, for example, is a bitcoin price that is twice as high as the energy value.
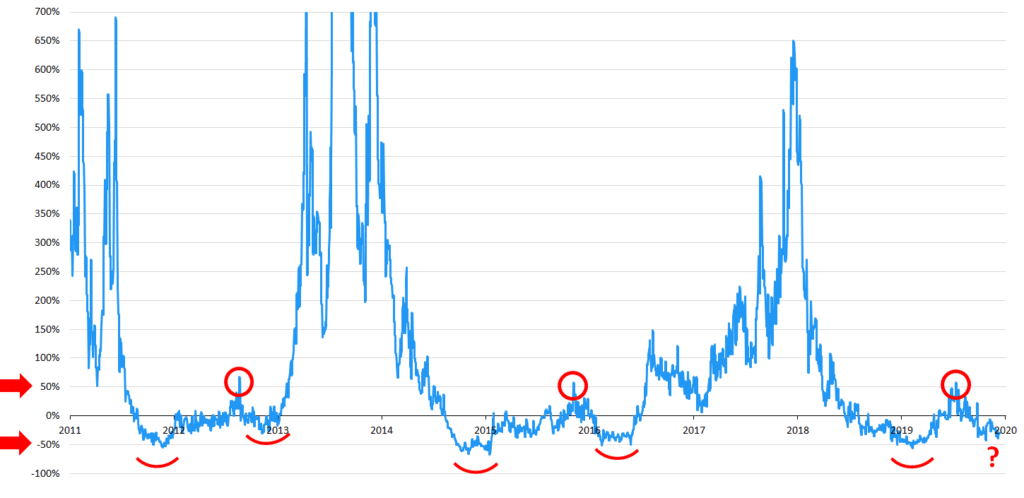
What you see is that the bitcoin price in a bull market is much higher than the energy value. After that the price falls all the way back to the energy value.
What is also striking is that the bitcoin rate is never long below the energy value. That can also be explained, because bitcoin miners will never lose for a long time.
Edwards has seen a pattern on this graph since 2011:
- First the price becomes lower than the energy value.
- Bitcoin shoots up, but the increase stops when the price is 50 percent higher than the energy value (the red circles).
- After this the price again falls below the energy value. That is the real bottom, and then the new bull market begins. According to Edwards, we are now in that phase.
With just two examples from the past, you don’t have much data to compare with. Still, the graph gives you new insights into the bitcoin market. Is it time for a new bull market?
Small mining companies run a loss
Charles Edwards also came up with the bitcoin production costs. Those are the average costs to mine a bitcoin.
He not only takes the electricity costs into account, but also the average expenses required to maintain a bitcoin mining company. There are no concrete figures for that, so he uses an average of data from CoinShares and BitFury, among others.
According to this data, the costs of a mining company consist of 60 percent energy costs. The remaining 40 percent consist of other costs. Consider, for example, insurance, interest, salary of staff and equipment depreciation.
With all this data you get this graph:
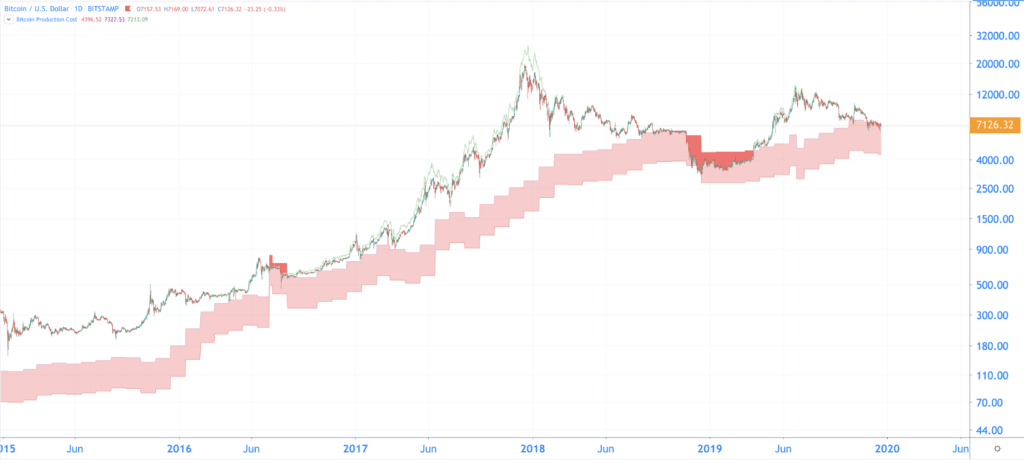
The bottom of the red band are the “bare costs”. Or the electricity costs to mine bitcoin. The top of the tire are the total costs, so all other costs are included.
Is the bitcoin course moving in the band? Then bitcoin mining companies can still pay the electricity costs, but they have to cut back on other costs.
Larger mining companies such as Bitfury often have a buffer to be able to absorb this loss briefly. For example, the equipment has already been purchased, and maintenance can be postponed. However, this situation should not last too long, because then these companies must take serious measures. Consider shutting down equipment or firing personnel.
But how are we doing now? Let’s zoom in on the graph:
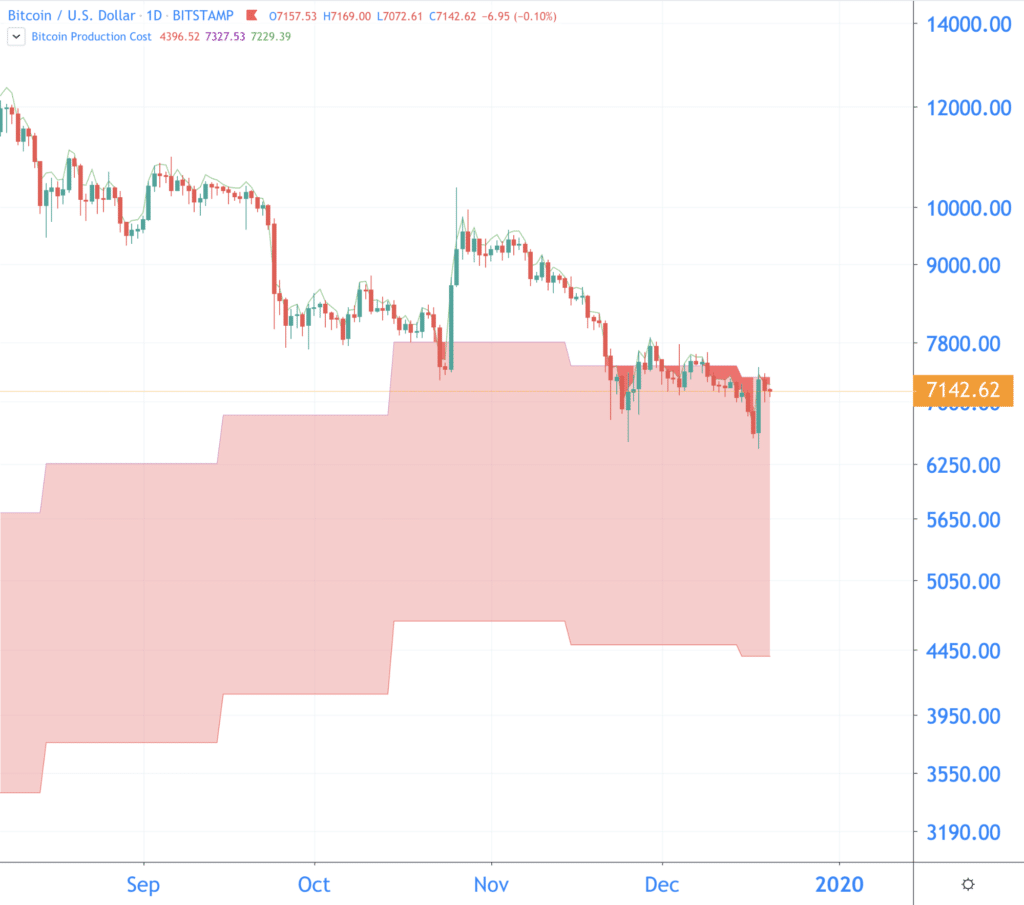
The bitcoin rate is at the top of the tire. Some (smaller) mining companies may therefore incur a loss and must economise. The absolute bottom of the tire is now at 4,400 dollars, at least according to the Edwards formula. The zone in which bitcoin is now located can serve as a base, because it often does not take long for the course to enter the band.
The Charles Edwards articles are worth reading! Do you want to read them back yourself? That is possible here:
Related posts:
 GitHub Libra Code draws criticism from users
  Tipping on Reddit and Vimeo in BAT introduced by Brave
  Newcomers to the crypto market have to pay attention to scams and pump and dumps
  Hardly any growth in downloaded crypto apps, despite tripling price bitcoin
  Bloomberg accepts Bitcoin – says cryptomonads are here to stay
  The Central Bank can release their cryptocurrencies earlier than expected


