


That was a shock again! The bitcoin course went down considerably last night. In just two hours, the value fell by almost 4.5 percent. Is the bear market back again, or is this a stopover on the way to the top?
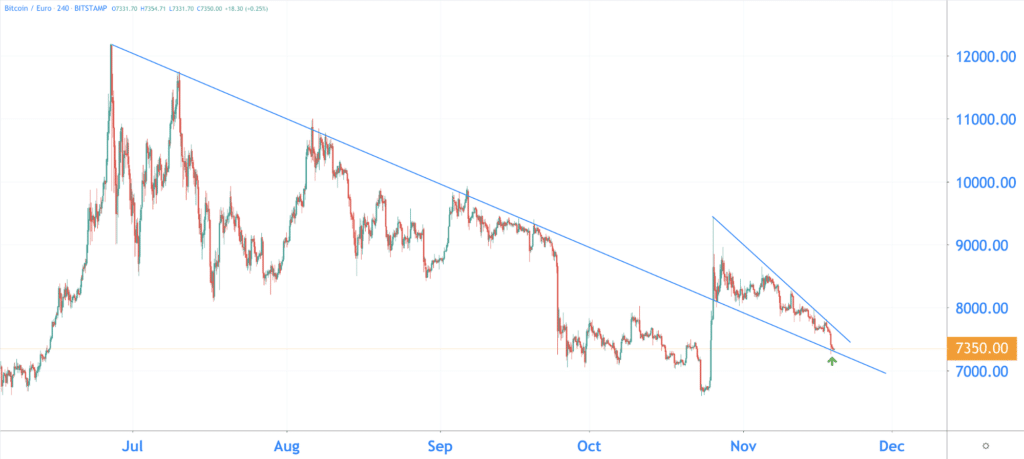
Time and time again not through the trend line
For weeks the bitcoin rate has not been able to break out of a falling trend line (on the graph in blue). Every attempt at an outbreak resulted in a sharp decline. And that happened yesterday. The course then made an attempt to break the trend line but failed. You can see that from the last red arrow.
For a moment the price seemed to have found support on the upper green zone. But once this zone was broken it went fast. The price of bitcoin fell by 4.5 percent.
Still above other trend lines
We zoom out a bit on the graph. You look at the bitcoin rate from the end of June until now.
On the positive side, the price is above another trend line. On the night of 25 to 26 October, the price broke through the bottom trend line with great violence. The price has now looked up this trend line again. Does bitcoin now find support on the trend line? That forms a good basis for rising.
“2019 line” also intact
In English they sometimes say: When in doubt, zoom out! So we are going to do that now. You can draw one big trend line under the bitcoin price of 2019. And the good news is that it is still intact. If the value remains above this trend line, there is actually nothing wrong:

Another death cross, new bear market coming?
Technical analyzes are sometimes just like the Tax Authorities: we cannot make it more fun. Another indicator shows a negative sign. We step away from the trend lines and compare two Moving Averages (MAs) with each other:
- The 100-day Moving Average (orange)
- The 200-day Moving Average (green)
When a short-term MA falls below a long-term MA, you call that a death cross. According to the technical analysis, that is not a good sign. It can be a prelude to a structural decline.
Recently the 100-day MA went under the 200-day MA. Will there be a new bear market now? When we compare the situation with that of 2018, it does not look good:

Better in the long run
But if you look at the longer term, it still looks good. We now compare the 50- and 100-MA, but then at the weekly level. And now the opposite seems to happen.
The 50-week MA (red) is about to rise above the 100-day MA (orange). You call that a golden cross, and that is a positive sign for the longer term.
Also positive is that the bitcoin course is still supported on the 100-week MA (the orange line). In the longer term, it seems that bitcoin has found a bottom before the price finds its way up again.
What do we expect from the bitcoin rate?
We are in a worse position than last week, but it doesn’t have to mean the end. We always remain objective, so we outline two farm-fresh scenarios for you!
Bullish
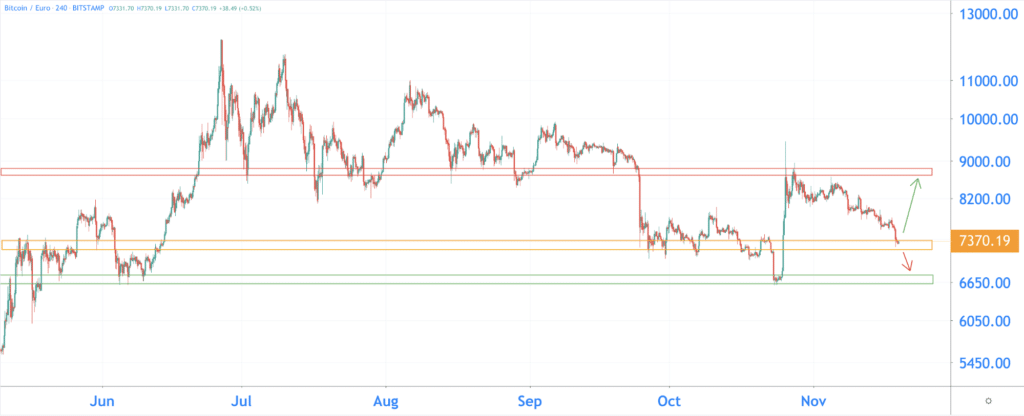
Does the course find the way up again? Then different levels are interesting. Bitcoin must first break through 7,600 euros. That is the value that the price went under yesterday. Next, 8,000 is an important resistance. Bitcoin seemed to find support there last week.
If the bitcoin succeeds in breaking out of these resistances, the road is clear to 8,700 euros (red bar).
Bearish
The course now seems to find support on the orange bar. Does the price fall below this level? Then it can sometimes go fast, the following support we find at 6,700 euros.
Related posts:
 GitHub Libra Code draws criticism from users
  Tipping on Reddit and Vimeo in BAT introduced by Brave
  Newcomers to the crypto market have to pay attention to scams and pump and dumps
  Hardly any growth in downloaded crypto apps, despite tripling price bitcoin
  Bloomberg accepts Bitcoin – says cryptomonads are here to stay
  The Central Bank can release their cryptocurrencies earlier than expected


