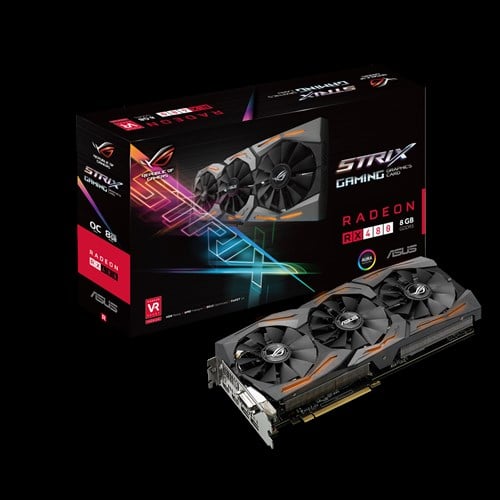
1. AMD Radeon RX 480 8 GB Video Card Review
Technical characteristics and recommended cost
Technical characteristics and cost of the AMD Radeon RX 480 video card are shown in the table in comparison with the reference AMD Radeon R9 390, Radeon R9 380X and NVIDIA GeForce GTX 1060.
* – According to Yandex.Market data as of 09/15/2016 .
PCB design and features
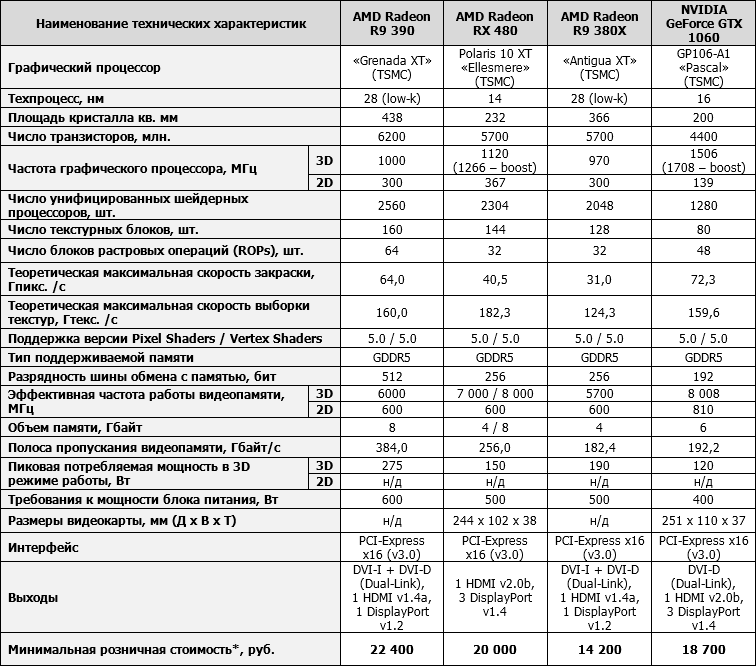
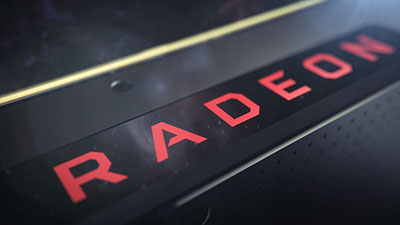
The AMD Radeon RX 480 reference design is virtually indistinguishable from that of the Radeon R9 Fury X and Nano, offering a simple and elegant 244 x 102 x 38mm graphics card. The entire front side is covered in a plastic wrap with a small, round cell structure, and a large RADEON engraving stamped on the left.
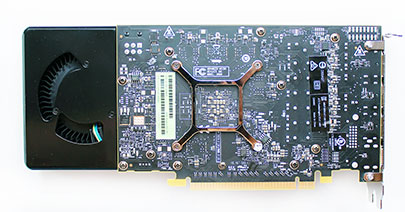
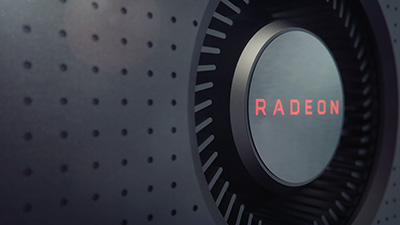
It can also be seen on the top of the cover.
Combined with a similarly designed propeller rotor, the Radeon RX 480 looks complete and tough.
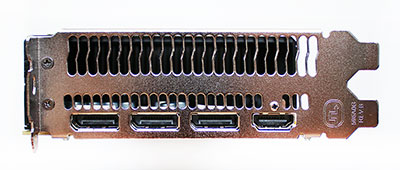
The video output board contains three DisplayPort version 1.4 and one HDMI version 2.0b.
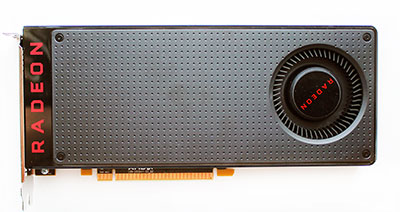
As you can see, most of this board is occupied by a grid for the unobstructed passage of hot air outside the system case. It should be noted that the video card becomes very hot.
The Radeon RX 480 is powered by a single 6-pin connector located on the top of the casing. The declared power consumption level of the video card is 150 watts, and for a system with one video card, it is recommended to use a 500 watt power supply. The power section of the printed circuit board is made according to a seven-phase scheme, in which six stages are allocated for powering the graphic processor and one for video memory.
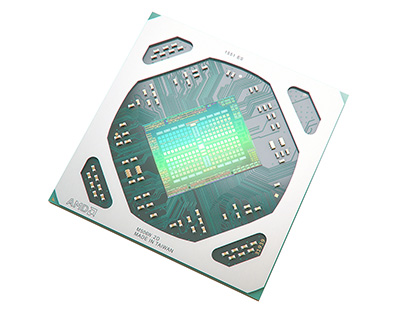
The new 14nm Polaris 10 XT GPU contains about 5.7 billion transistors and contains 2,304 uniform shaders, 144 texture units, and 32 point operations (ROPs).
The frequency of the GPU in 3D mode should vary in the range from 1120 to 1266 MHz, but in practice this was not always the case, which we will discuss below.
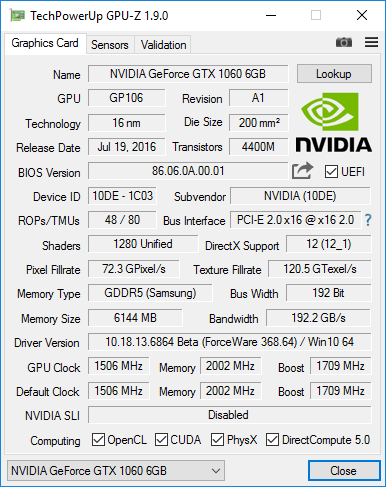
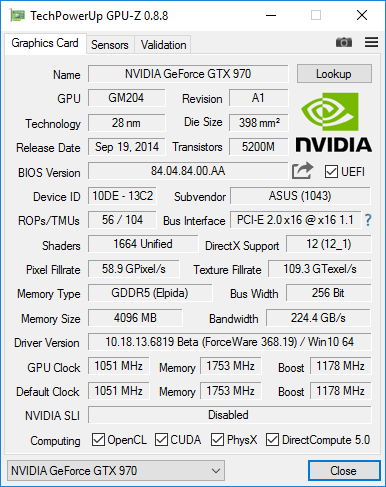
The Radeon RX 480 can be equipped with 4GB ($199) or 8GB ($229) of video memory. Our version of the video card has 8GB of DDR5 memory with Samsung chipsets (according to GPU-Z).
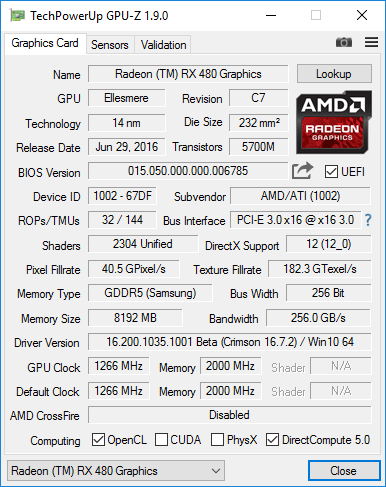
The effective frequency of the video memory is 8000MHz, which with a 256-bit bus can provide a bandwidth of 256 GB / s. This is immediately 33% higher than the main competitor NVIDIA GeForce GTX 1060 with a 192-bit bus (192.2 GB / s).
Cooling system
From a practical point of view, it makes no sense to evaluate the efficiency of the standard cooler of the reference version of the AMD Radeon RX 480, since now original versions with branded coolers have appeared on the market. But since it has not yet come to us, there is no choice, so today we are going to test the standard cooler, which is a combination of an aluminum radiator with a copper base for the GPU, a metal heat distribution plate for the power circuits and a turbine that pumps air through the radiator.
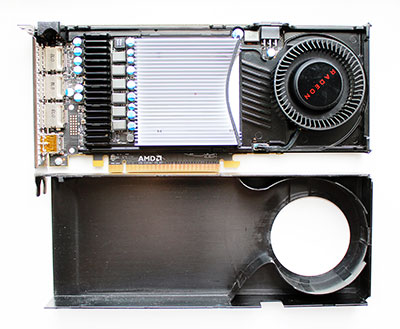
The entire system is covered with a plastic wrap that directs the air heated by the video card to the board with the video outputs and a grill. The turbine speed is regulated by PWM in the range from 1200 to 4960 rpm.
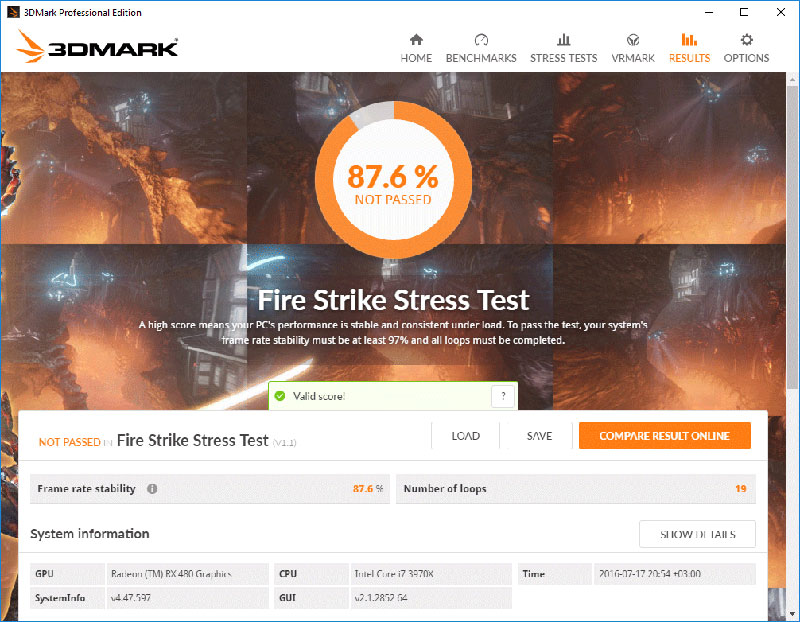
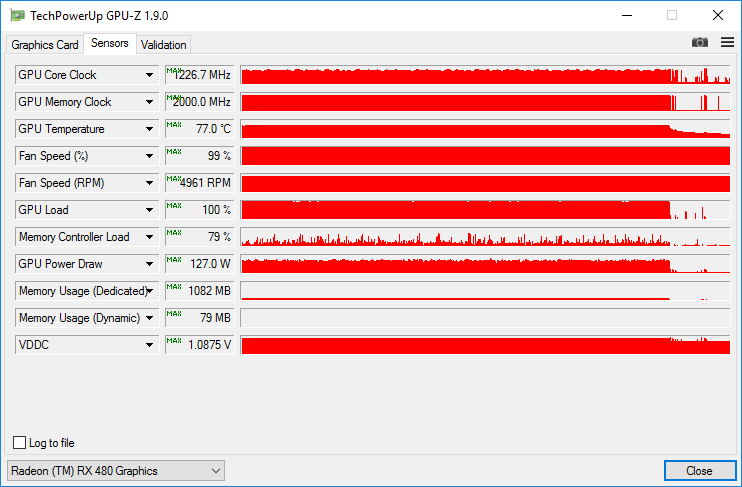
We used nineteen cycles of the 3DMark stress test to test the video card’s temperature as a load.
Since we did not have an updated version of MSI Afterburner at the time of writing, we used GPU-Z utility version 1.9.0 to monitor temperatures. All tests were carried out in a closed case of the system unit, the configuration of which you can see in the next section of the article, at an average room temperature of 25
° C.
First, we checked the video card temperature mode with fully automatic fan speed control.
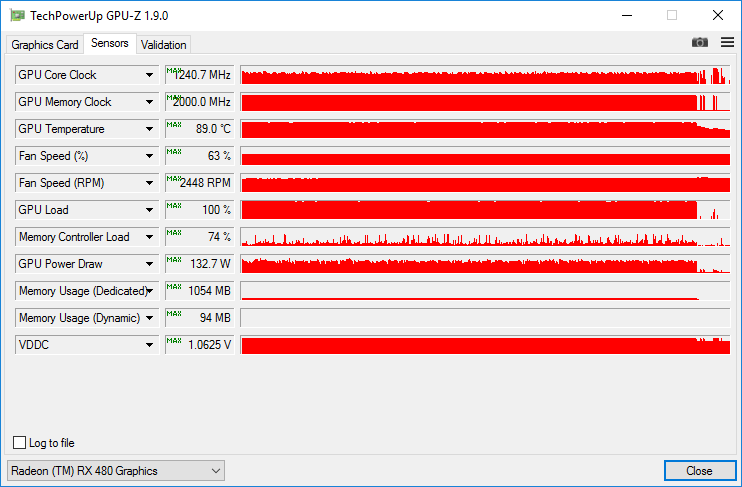
Auto mode (1200~2450rpm)
Temperatures are too high, and it is clear that the stock cooler, even after overclocking to 2450 rpm, is simply not suitable for ensuring that the Radeon RX 480 runs at the maximum standard frequency of 1266 MHz, since during testing it dropped to 1000 MHz, and on average u200bu200b” Floating” “at the 1050-1070MHz mark.
At the maximum possible fan speed for the cooler, the peak temperature of the processor is 12 ° C lower, as a result of which the GPU frequency does not jump as much as with automatic tuning.
Top speed (~4960 rpm)
Significantly, the stability of the video card in the 3DMark stress test also increased from 87.6% to 97.8%.
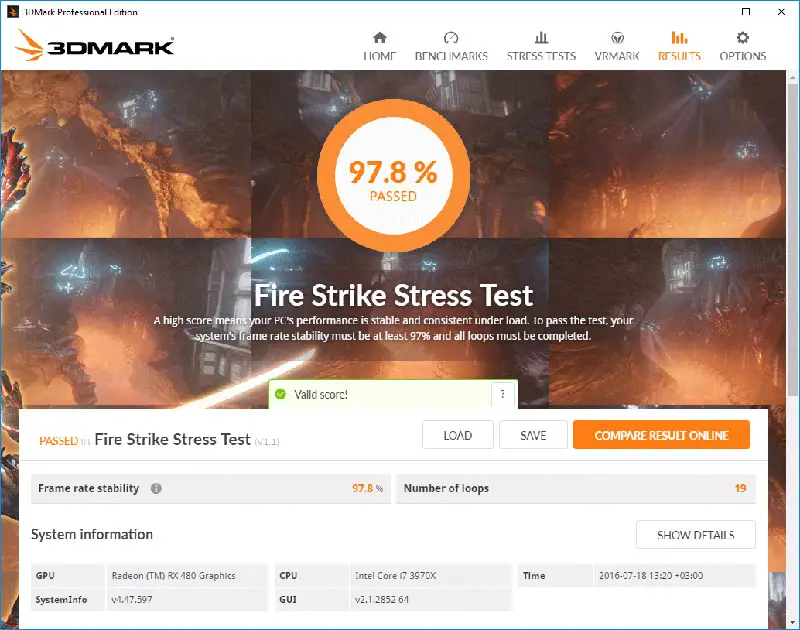
Therefore, we can conclude that in order to ensure the stable operation of the Radeon RX 480 and maintain the GPU frequency (and thus performance) at a high level, it needs unprecedented effective cooling, despite the new 14nm process technology.
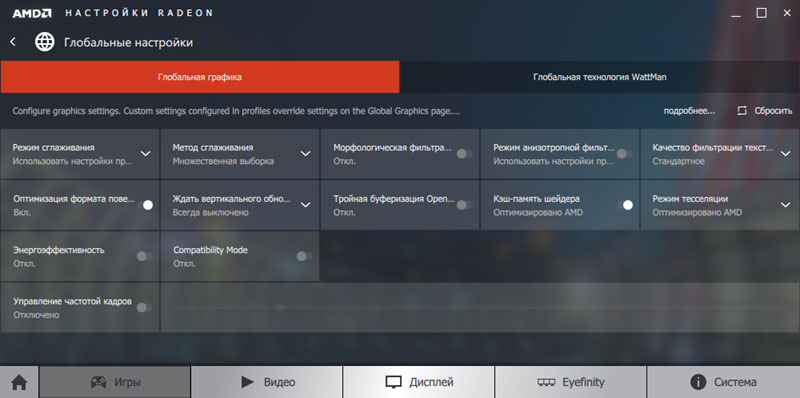
As for overclocking, for obvious reasons we have not studied it on the reference video card. Let’s hope that the original Radeon RX 480 models allow us to fully expose this issue and learn about AMD’s WattMan technology, which is being implemented in conjunction with the advent of the Radeon RX 480.
2. Testing configuration, tools and testing methodology
Closed box video card performance testing was conducted on a system with the following configuration:
Motherboard: ASUS Sabertooth X79 (Intel X79 Express, LGA2011, BIOS 4801 dated 07/28/2014);
CPU: Intel Core i7-3970X Extreme Edition 3.5/4.0 GHz (Sandy Bridge-E, C2, 1.1 V, 6 x 256 KB L2, 15 MB L3);
CPU Cooling System: ARCTIC Liquid Freezer 240 (4 x 1100 rpm);
Thermal interface: ARCTIC MX-4;
video cards:
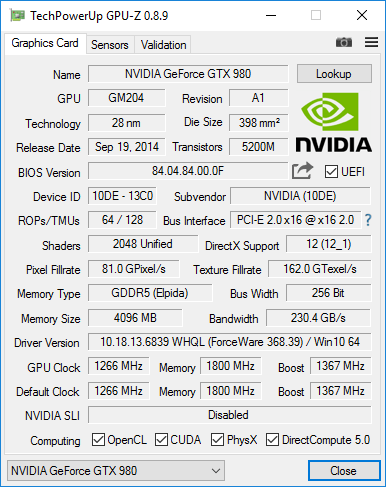
Inno3D iChill GF GTX 980 Ultra HerculeZ X4 Air Boss 4 GB 1266-1367/7200 MHz;
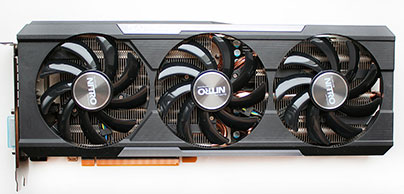
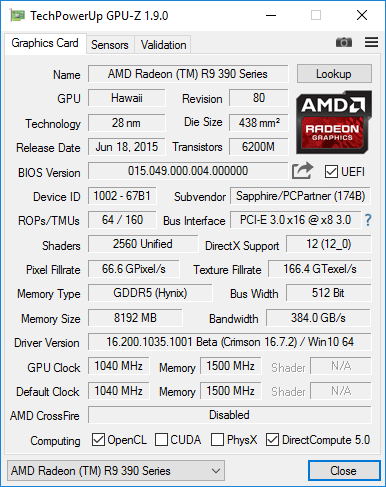
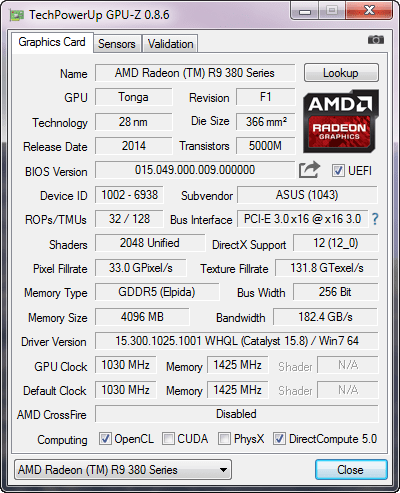
Sapphire NITRO R9390 OC Tri-X 8GB 1040/6000MHz;
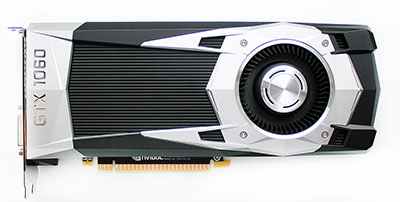
NVIDIA GeForce GTX 1060 Founders Edition 6GB 1506-1708 (1886) / 8008MHz;
AMD Radeon RX 480 8 GB 1120-1266 / 8000MHz;
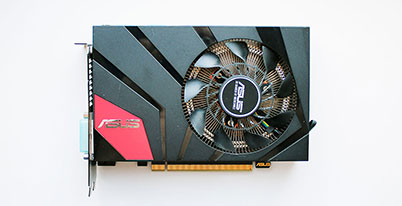
ASUS GeForce GTX 970 DC Mini 4GB 1050-1178 / 7012MHz (GTX970-DCMOC-4GD5);
ASUS STRIX R9 380X Gaming 4 GB 1030/5700 MHz;
RAM: DDR3 4 x 8 GB G.SKILL TridentX F3-2133C9Q-32GTX (XMP 2133MHz, 9-11-11-31, 1.6V);
System and gaming disk: Intel SSD 730480 GB ( SATA-III, BIOS vL2010400);
Disk for storing software and games: Western Digital VelociRaptor (SATA-II, 300 GB, 10,000 rpm, 16 MB, NCQ);
Archive disk: Samsung Ecogreen F4 HD204UI (SATA-II, 2 TB, 5400 rpm, 32 MB, NCQ);
Sound Card: Auzen X-Fi HomeTheater HD;
Chassis: ThermalTech Core X71 (four Stay Quiet! Silent Wings 2 (BL063) at 900 rpm);
Control Panel: Zalman ZM-MFC3
pSU: Corsair AX1500i Digital ATX (1500W, 80 Plus Titanium), 140mm fan.
Monitor: 27 inch Samsung S27A850D (DVI, 2560 x 1440, 60 Hz).
As the highest performance benchmark for the AMD Radeon RX 480, we’ve included the original Inno3D iChill GF GTX 980 Ultra HerculeZ X4 Air Boss from NVIDIA and the original Sapphire NITRO R9 390 OC Tri-X from AMD.
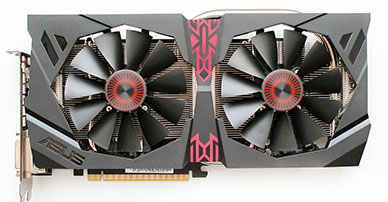
A direct competitor to today’s test hero will be the NVIDIA GeForce GTX 1060, which is represented by the reference version of the Founders Edition. Next to it in the photo is the ASUS STRIX R9 380X Gaming, which, after marking video cards in the AMD line, was replaced by the new Radeon RX 480.
And finally, the fifth video card under test is the ASUS GeForce GTX 970 DC Mini, which, oddly enough, today is barely cheaper than the Radeon RX 480, which means that it can also compete with it by default.
Let’s add that the Power Limit value on all video cards is set to the maximum.
To reduce the dependence of the performance of video cards on the speed of the platform, a hexa-core 32 nm processor with a 48 multiplier, a reference frequency of 100 MHz and a load line calibration function activated at Ultra High has been overclocked. 4.8GHz when the voltage in the BIOS of the motherboard rises to 1.385V.
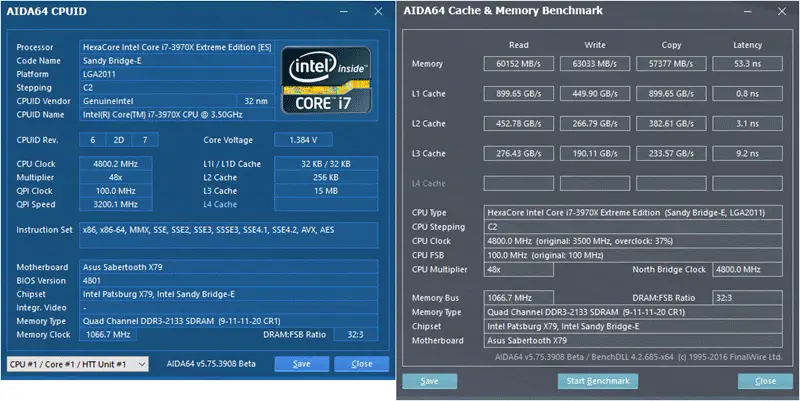
Hyper-Threading technology has been activated. At the same time, 32 GB of RAM ran at a frequency of 2.133 GHz with a timing of 9-11-11-20_CR1 at a voltage of 1.6125 V.
Testing, which began on August 8, 2016, was conducted on Microsoft Windows 10 Professional with all updates as of the specified date and with the following drivers installed:
Intel Chipset Drivers – 10.1.1.27 WHQL from 06.07.2016;
Intel Management Engine Interface (MEI) – 11.5.0.1019 WHQL from 08/09/2016;
Drivers for video cards on NVIDIA GPUs – GeForce 369.05 WHQL from 04/2016;
Video Card Drivers on AMD GPUs – AMD Radeon Software Crimson 16.8.1 WHQL from 07/08/2016.
Graphics cards have been tested with resolutions of 1920 x 1080 and 2560 x 1440 pixels. Two graphics quality modes were used for the tests: Quality + AF16x – texture quality in drivers by default with anisotropic filtering at 16x and Quality + AF16x + MSAA 4x (8x) with anisotropic filtering at 16x and fullscreen smoothing at 4x or 8x, in cases when The average u200bu200 frames per second remained high enough for comfortable gameplay. In some games, due to the characteristics of their game engines, other anti-aliasing algorithms were used, which will be indicated later in the methodology and diagrams. Anisotropic filtering and full screen refinement are enabled directly in the game settings. If these settings are absent in games, then the parameters are changed in the control panel of the Crimson or GeForce drivers. V-Sync has also been forcibly disabled there. In addition to the above, no additional changes were made to the driver settings.
Video cards have been tested in one semi-synthetic graphics test and in fifteen games, they have been updated to the latest versions as of the date this material was prepared. The list of test apps is as follows (games and other test results in them are in the order of their official release):
3DMark (DirectX 9/11/12) – version 2.1.2852, tested in Fire Strike, Fire Strike Extreme, Fire Strike Ultra and Time Spy scenes; Crysis 3 (DirectX 11) – version 1.3.0.0, all graphics quality settings to max, blur medium, glare on, modes with FXAA and by MSAA 4x, sequential double-pass of scene written from the start of a Swamp job lasting 105 seconds; metro light past (DirectX 11) – version 1.0.0.15, built-in game test, graphics quality settings and tessellation at a very high level, advanced PhysX technology in two test modes, tests with SSAA and without anti-aliasing, a dual-sequence D6 scene used; Heroes Company 2
(DirectX 11) – Version 4.0.0.21543, sequential double run of the in-game test with maximum settings for graphics quality and physical effects; Battlefield 4 (DirectX 11) – version 1.2.0.1, all graphics quality settings on Ultra, double sequential playback of the scene written from the start of the TASHGAR task for 110 seconds (for video cards on AMD GPUs, the Mantle API was used); Thief (DirectX 11) – version 1.7 of 4158.21 activated, graphics quality settings to maximum, Paralax Occlusion Mapping and Tessellation technologies, dual sequential playback of the in-game standard (for video cards based on AMD GPUs, API Mantle was used); Elite Sniper III
(DirectX 11) – Version 1.15a, quality settings in Ultra, V-Sync disabled, tessellation and all effects enabled, tests with SSAA 4x and no anti-aliasing, dual sequential playback of the in-game benchmark (for AMD GPU-based graphics cards , API Mantle was used );
(DirectX 11) – Version 1951.27, all quality settings are manually set to maximum and ultra levels, tessellation and depth of field are activated, at least 2 consecutive times of in-game standards; Grand Theft Auto V (DirectX 11) – version 757.4, quality settings are too high, Ignore suggested restrictions enabled, V-Sync disabled, FXAA enabled, NVIDIA TXAA disabled, MSAA disabled for reflections, NVIDIA/AMD soft shadows; Dirt Rally
(DirectX 11) – version 1.2, we used the built-in test on the Okutama track, graphics quality settings to the maximum level for all points, Advanced Blending – On; Tests with MSAA 8x and without anti-aliasing; Batman: Arkham Knight (DirectX 11) – Version 1.6.2.0, Quality settings at High, Texture Resolutioin normal, Anti-Aliasing on, V-Sync disabled, Tests in two modes – with or without last two NVIDIA GameWorks options activated On Built-in double sequential in-game dough (DirectX 11) – version 3.1, texture quality settings at very high, texture filtering – 16X anisotropic, other maximum quality settings, tests with MSAA 4x and no anti-aliasing, double sequential run for in-game testing. Rise of the Tomb Raider
(DirectX 12) – Version 1.0 Build 668.1_64, all parameters at very high, dynamic foliage – high, ambient occlusion – HBAO+ activated, mosaics and other quality improvement techniques, two test cycles of the built-in benchmark (Ground Heat Valley scene) no anti-aliasing And with SSAA 4.0 activated; Primitive Far Cry (DirectX 11) – Version 1.3.3, maximum quality level, HD textures, maximum volumetric blur and shadows, built-in performance test without anti-aliasing and SMAA activation; Tom Clancy’s Partition (DirectX 11) – version 1.3, maximum quality, all image optimization parameters are activated, Temporal AA – Supersampling, test modes without anti-aliasing and with SMAA 1X Ultra activated, built-in performance test, but select FRAPS results; Assassin
(DirectX 12) – Version 1.2.2, Embedded test with Ultra-level graphics quality settings, SSAO enabled, Ultra shadow quality, Memory protection disabled.
If the games implemented the ability to fix the minimum number of frames per second, then this was also reflected in the charts. Each test was performed twice, and the two best values obtained were taken as the final result, but only if the difference between them did not exceed 1%. If the deviations in the pilot tests exceed 1%, the test is repeated at least one more time to obtain a reliable result.