


It was a great week for altcoins such as XLM (30%), ETH (15%) and XRP (14%). The question we answer in this analysis: could we have seen this coming? We also look at the bitcoin price.
Well, we could have seen it coming
Altcoins such as Stellar (XLM) have been preparing for a price rise for months. That only happens in the background. The graph below shows the Stellar (XLM) graph expressed in bitcoin. So the graph does not show the value in dollars or euros, as you may be used to.
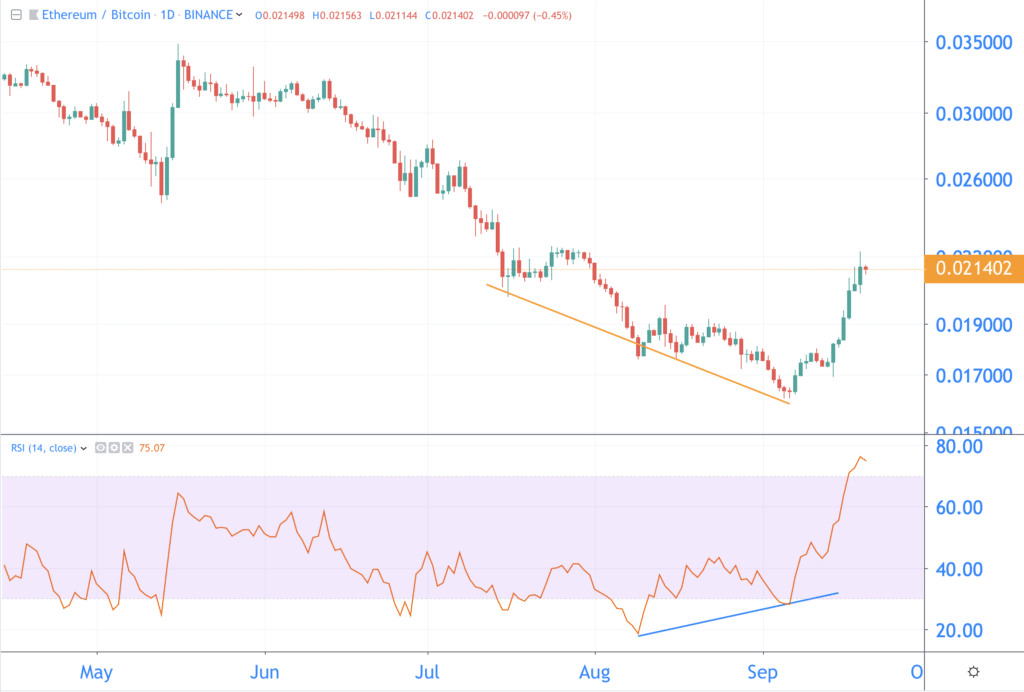
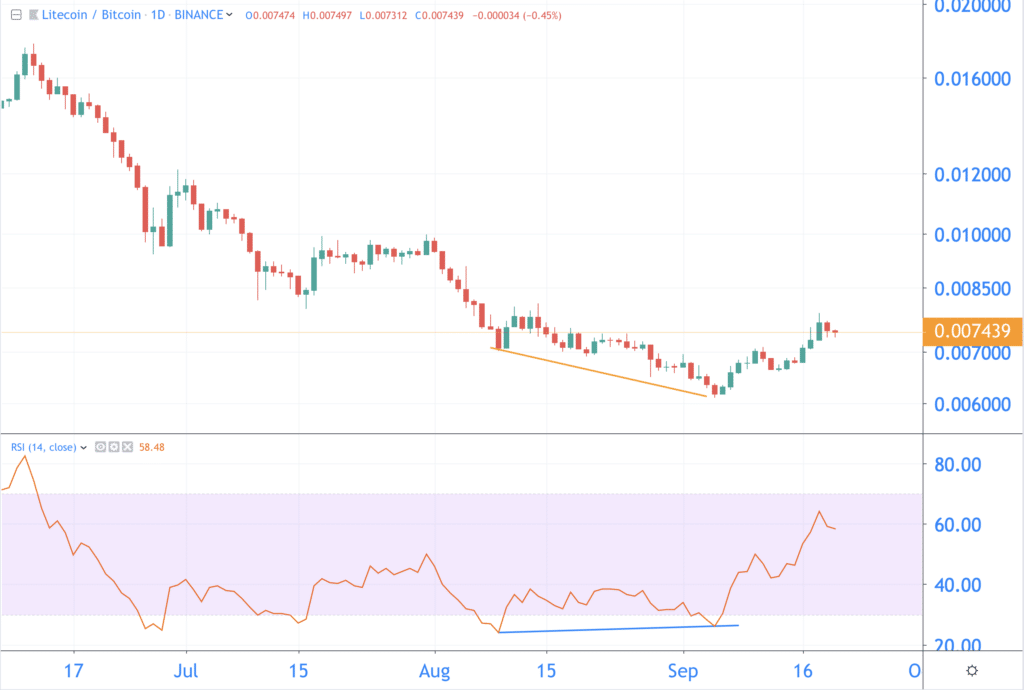
This chart is useful for investors who want to earn more bitcoin through trading in altcoins. If you see a green candle, the price of an altcoin rises faster than bitcoin.
But hey, I stray. You see negative divergence on the graph. And that can be a harbinger of a significant increase. One that we saw last Wednesday.
Negative divergence? This means that the Stellar (XLM) price is making lower and lower bottoms. You can see that on the graph with the falling orange trend line. But the RSI is rising relatively. Bottoms can also be seen there, but they are getting higher and higher. We indicate this on the graph with the rising orange trend line. This difference between course and RSI is therefore called negative divergence.
You can also see that the RSI is now very high. When the RSI is above the purple zone you speak of overbought. The exchange rate has risen too fast and may therefore fall somewhat in the coming days.
This is also the case with other altcoins
Then you probably think: yes, but that is only one example. But you also see the same pattern with other altcoins. Let’s take a tour of different altcoins. All graphs are compared to bitcoin.
Ethereum (ETH):
Litecoin (LTC)
With Ripple (XRP) even since May, if we draw the trend lines less accurately:

Rectification: about the RSI and the bitcoin rate
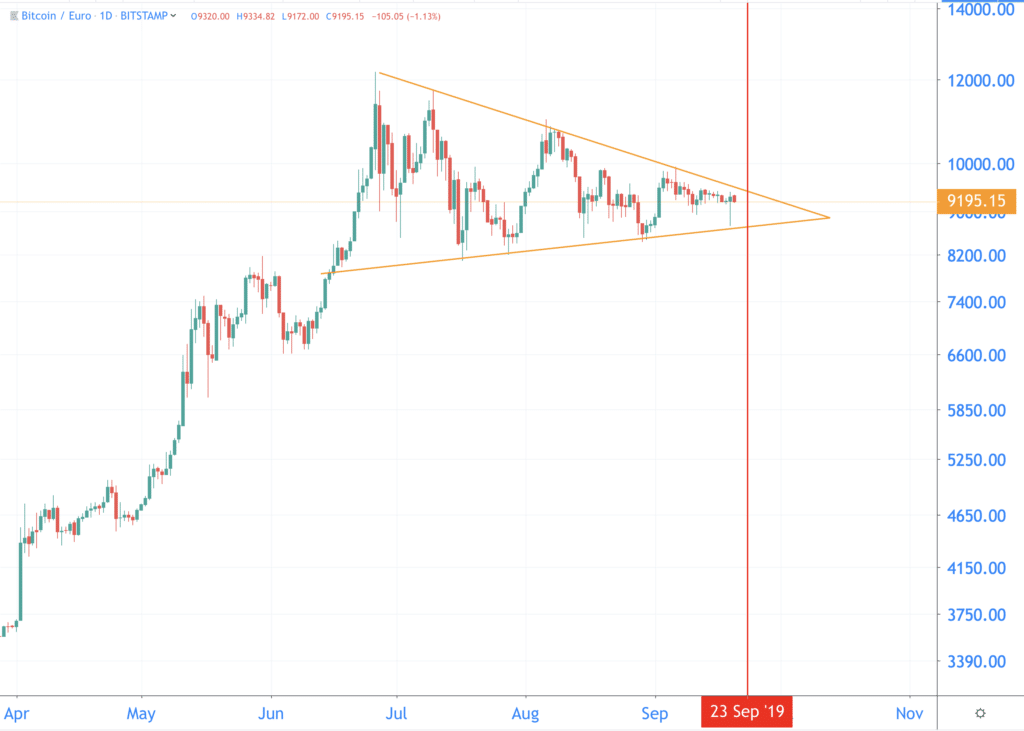
We conclude with a short rectification and a look at the bitcoin course. In the YouTube comments there were a few comments about Tuesday’s price analysis. And they were right. We had not been completely clear in our last analysis.
We may have drawn a conclusion too quickly as a result of a tweet about the RSI and the bitcoin course. It is currently difficult to say anything about the bitcoin course if you place it next to the RSI. We want to thank you for your attention!
In the coming days it will in any case remain interesting to follow the triangle (yes damn it is there again). But before the triangle ends, there is the launch of Bakkt on Monday, September 23. Let’s speculate. What could happen?
- Positive: The hype is real. Bakkt just gives that one push up and bitcoin breaks out of the triangle at the top. The course is preparing for the all-time high.
- Neutral: Bakkt has no influence on the price. We have to wait until the triangle has finished, until mid-October.
- Negative: Buy the rumors, sell the news. It is possible that the launch of Bakkt is already priced in. Investors grab their profits at the time of the launch, and the price of bitcoin is falling as a result.
Related posts:
 GitHub Libra Code draws criticism from users
  Tipping on Reddit and Vimeo in BAT introduced by Brave
  Newcomers to the crypto market have to pay attention to scams and pump and dumps
  Hardly any growth in downloaded crypto apps, despite tripling price bitcoin
  Bloomberg accepts Bitcoin – says cryptomonads are here to stay
  The Central Bank can release their cryptocurrencies earlier than expected


