It was another wild week for bitcoin! From Monday 7 October to this morning the rate rose by more than 13 percent. And this morning at seven in the morning the rate fell again by more than 5 percent in an hour. You can say what you want, but following the bitcoin course is nice and exciting again.
Outbreak from trend line
The graph below shows the rate of bitcoin in euros. Each candle on the graph represents four hours:
In recent weeks, the price of bitcoin has made several attempts to rise. But the tops became lower every time. You can see that in the sloping trend line.
On Wednesday, October 9, the trend of bitcoin broke through the trend line. You can see that moment on the graph indicated by the blue ball. Bitcoin then rose by more than six percent in three hours! But this party did not last long.
Moving Average remains difficult resistance
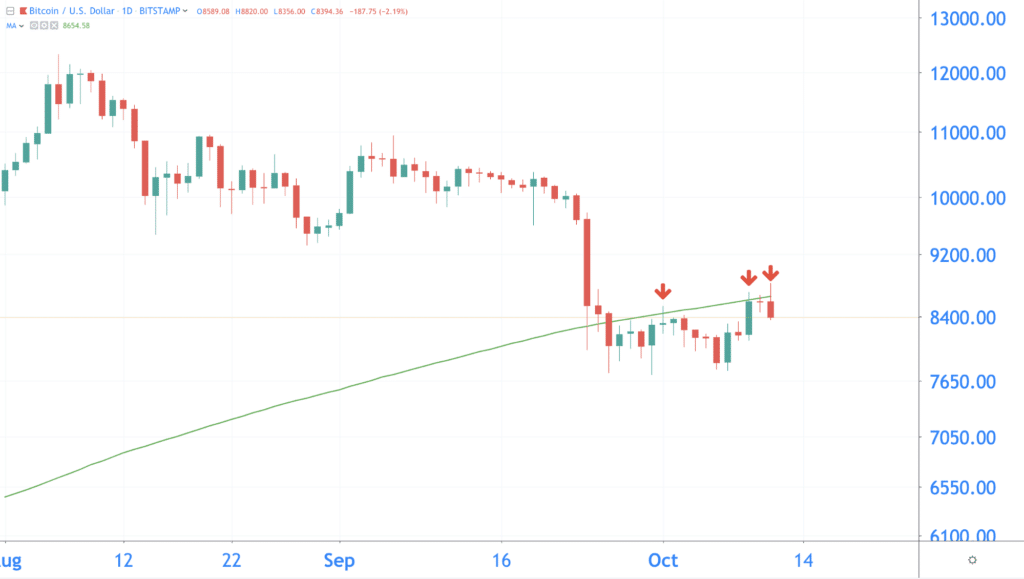
Then why the sudden fall? It seems like the bitcoin course has trouble breaking the 200-day Moving Average. This moving average is shown on the graph below with the green line. Every time bitcoin makes an attempt to rise above this line, it drops again.
This resistance becomes clear when we look at the graph in US dollars. The graph is zoomed out a little, each candle now represents one day:

Bitcoin in no man’s land
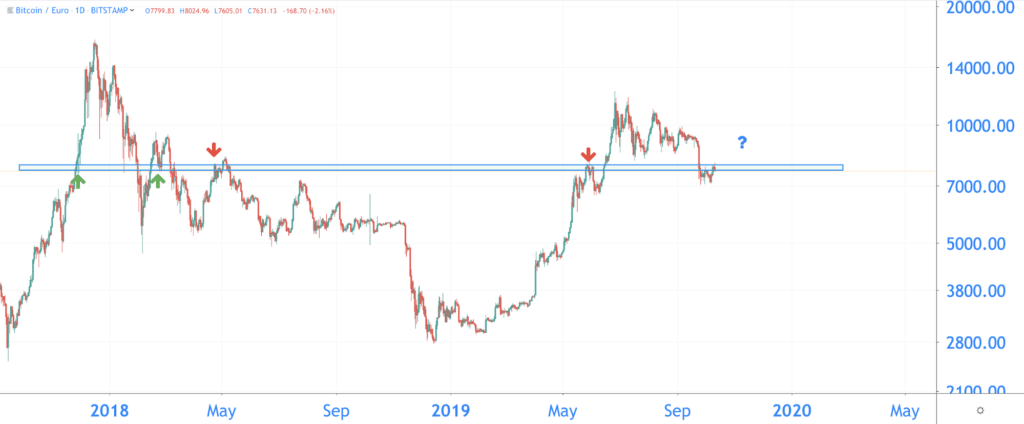
Where is the bitcoin price going now? To get a clearer picture, we zoom out the graph even further. You are now looking at the bitcoin rate from the end of 2017 to the present.
The exchange rate is moving around an important zone, between 7,700 euros and 7,900 euros. In the past, this zone had alternately been a support (green arrows) and a resistance (red arrows).
What will this zone do for bitcoin now? That will become clear in the coming days.

Old trend lines come together
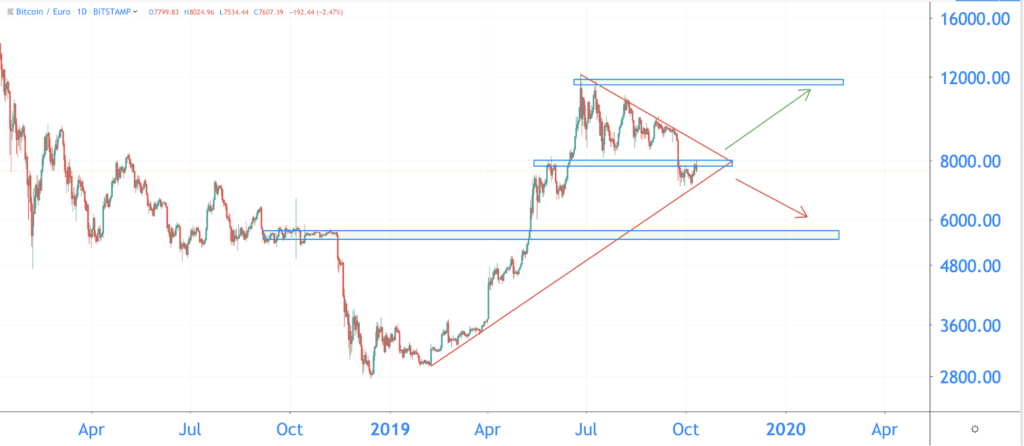
But not only the resistance and support is interesting. It is also possible that bitcoin will look for an old trend line again. Between February and the end of March, the price moved up this trend line. It is possible that this trend line offers support for bitcoin.
And at the top you see the falling trend line that bitcoin has struggled with in recent months. Is the price breaking at the top of this trend line? Then that is a very positive sign. That could mean a rise towards the old summit of 11,500 euros.
A decrease is also possible if the middle zone proves to be a strong resistance. In the most pessimistic scenario, bitcoin can then fall to 5,500 euros.


