


Since our previous price analysis last Friday, the bitcoin rate has risen by 3.7 percent. Is this the end of the falling trend? Some indicators look positive in any case!
Last Sunday an increase of five percent
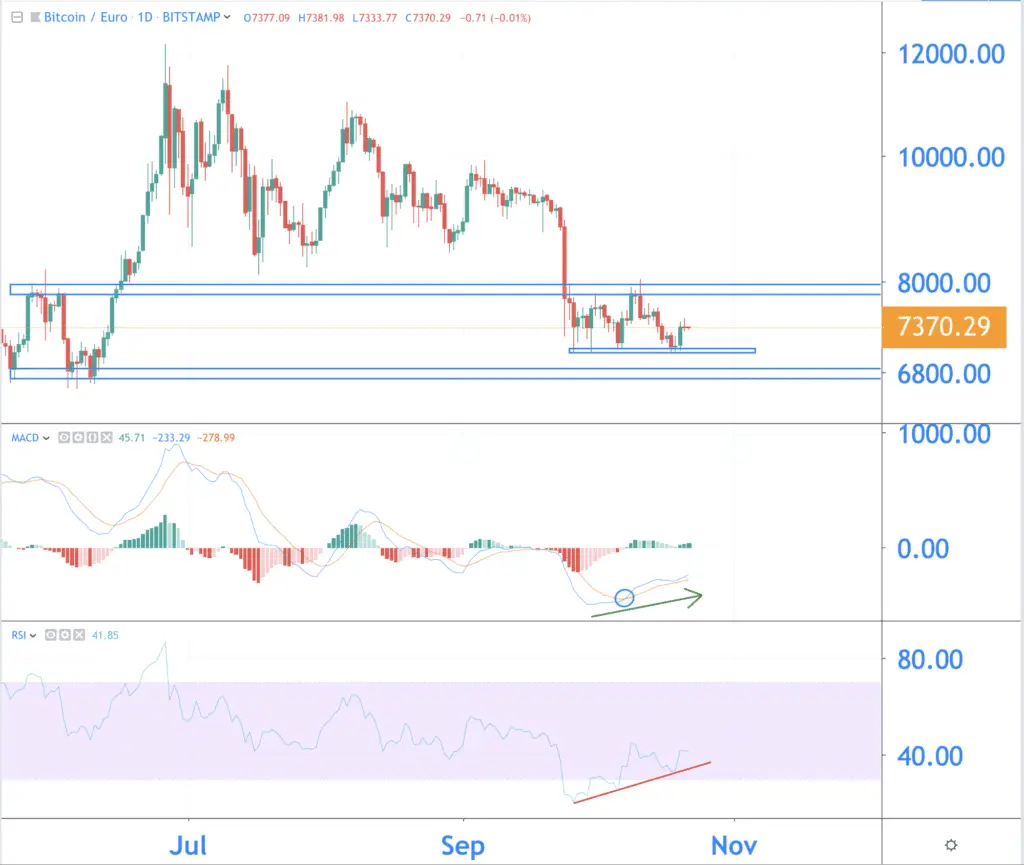
Last week we wrote about divergence between the course and the RSI. The price then fell, but the RSI showed higher bottoms. This is usually the reason for a price rise.
And that was the case now. Last Sunday, the bitcoin rate rose by no less than five percent. Today the rate is fairly stable. We are actually back a bit back. the rate is at the same level as last Tuesday. Then the rate also fluctuated around 7,400 euros.
Indicators are positive
If we look at the day chart, it looks good for bitcoin. Both the RSI and the MACD indicator show a positive momentum.
On the MACD (middle graph) you see a bullish cross. We have indicated this with the circle. The short-term line then rises above the long-term line. This is often a signal for a reversal of the falling trend.
The RSI also continues to rise gradually. Earlier this month there was even divergence. The price made lower bottoms, but the RSI rose relatively.
However, the 8,000 euro zone remains a strong resistance. Bitcoin has not yet managed to rise above this level this month.
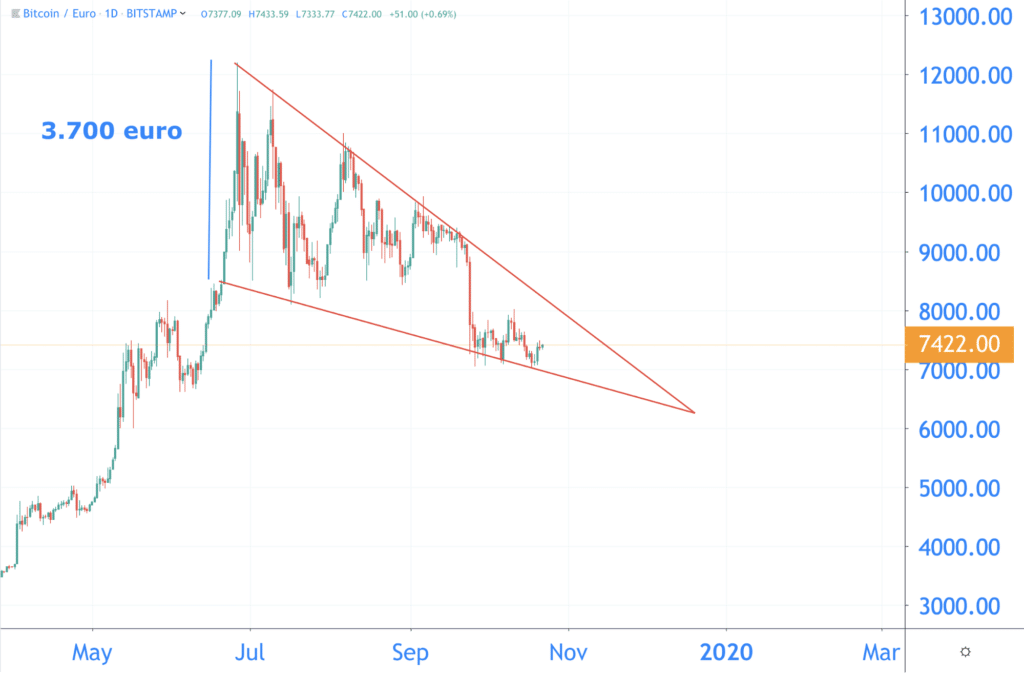
Price may move in a falling wedge
It is still a bit of speculation, but it is also possible that the price is forming a falling wedge.
A falling wedge is a price formation that in most cases leads to a price rise. In a falling wedge the price moves between two falling trend lines. The outbreak from a falling wedge is usually upwards.
With a falling wedge, the rise is as large as the “opening” of the triangle. That is now around 3,800 euros
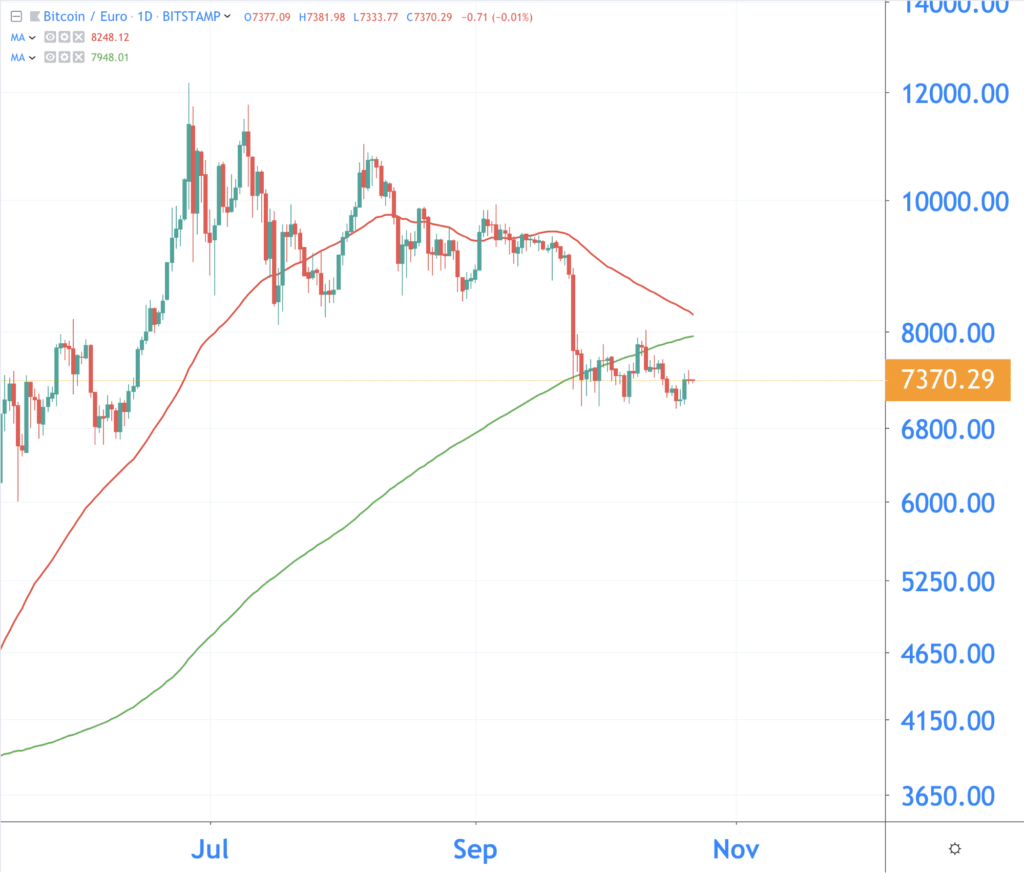
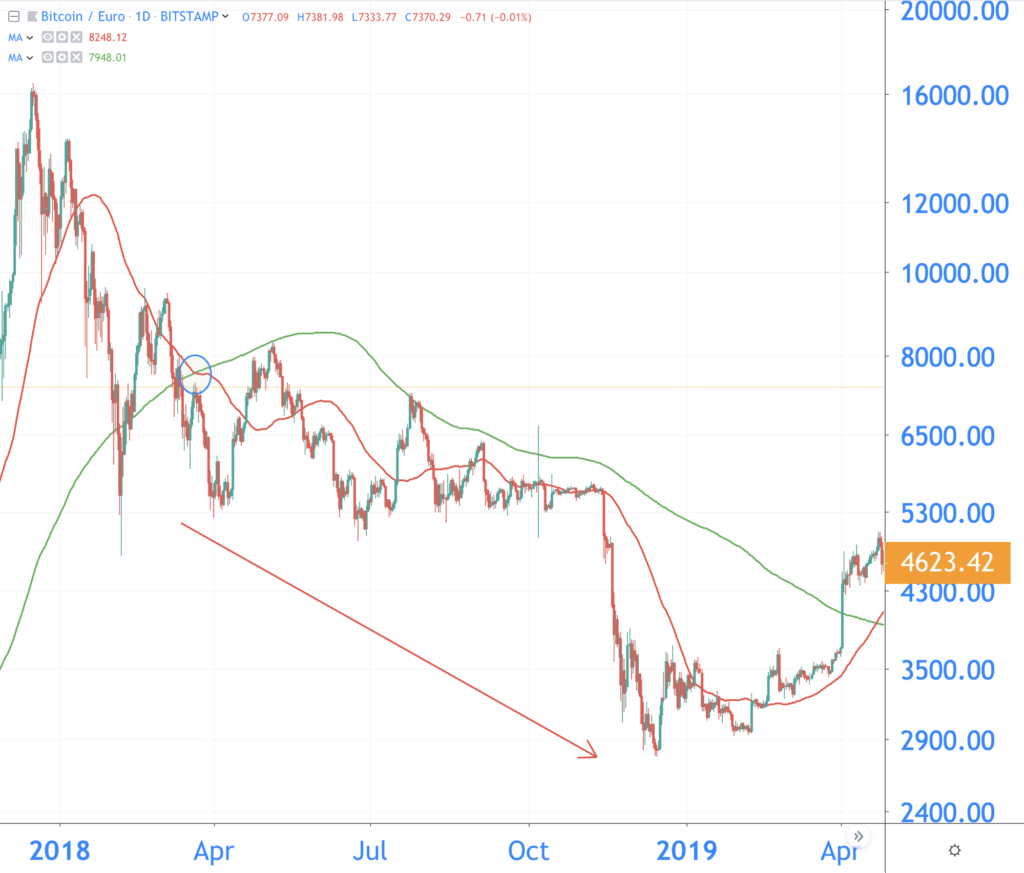
Death cross is still lurking
But the death cross is still lurking. With a death cross, a short-term Moving Average drops below a long-term Moving Average. Most analysts then compare the 50-day MA (here in red) with the 200-day MA (here in green).
A death cross is a negative sign for the course in the long term. A death cross usually means a long-term decline.
The last death cross was on March 21, 2018. Then the rate fell from 7,400 euros to 2,800 euros. From mid-December 2018, the rate began to recover somewhat, and it was not until April this year that the rate found its way up again.
What will the rate do now?
In fact, little has changed since our last price analysis on Friday. As the price is still moving sideways, the same zones therefore remain valid.
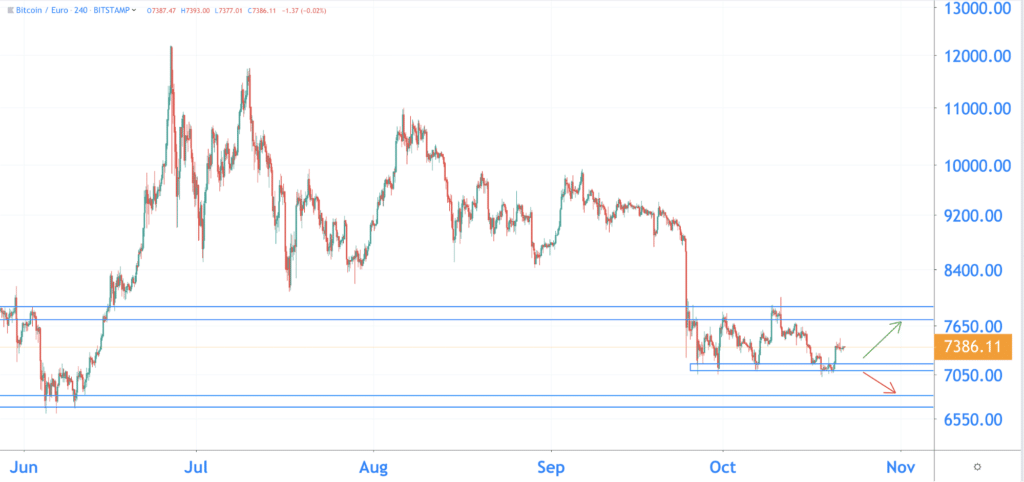
Bullish
Is bitcoin rising even further this week? Then 8,000 euros is quite a resistance. The exchange rate has struggled several times this month to rise above that level.
Bearish
If bitcoin is falling, we can find the first support at around 7,100 euros. The price of bitcoin has not fallen below this level this month. If bitcoin falls below this zone, then 6,700 euros is an important next support.
Related posts:
 GitHub Libra Code draws criticism from users
  Tipping on Reddit and Vimeo in BAT introduced by Brave
  Newcomers to the crypto market have to pay attention to scams and pump and dumps
  Hardly any growth in downloaded crypto apps, despite tripling price bitcoin
  Bloomberg accepts Bitcoin – says cryptomonads are here to stay
  The Central Bank can release their cryptocurrencies earlier than expected


