


Last Tuesday we wrote in our price analysis that bitcoin was in a triangle. And if it broke out at the bottom, the bitcoin rate could just drop to 8,500 euros. After the crash of the past two days, we are (unfortunately) on our way to that bearish scenario.
Decrease of 16 percent
At the time of the previous price analysis, one bitcoin was worth 10,186 euros. This morning only 8,584 euros, a decrease of just under 16 percent. In this article we describe the price movement on the basis of indicators. Do you always want to stay informed of the course?
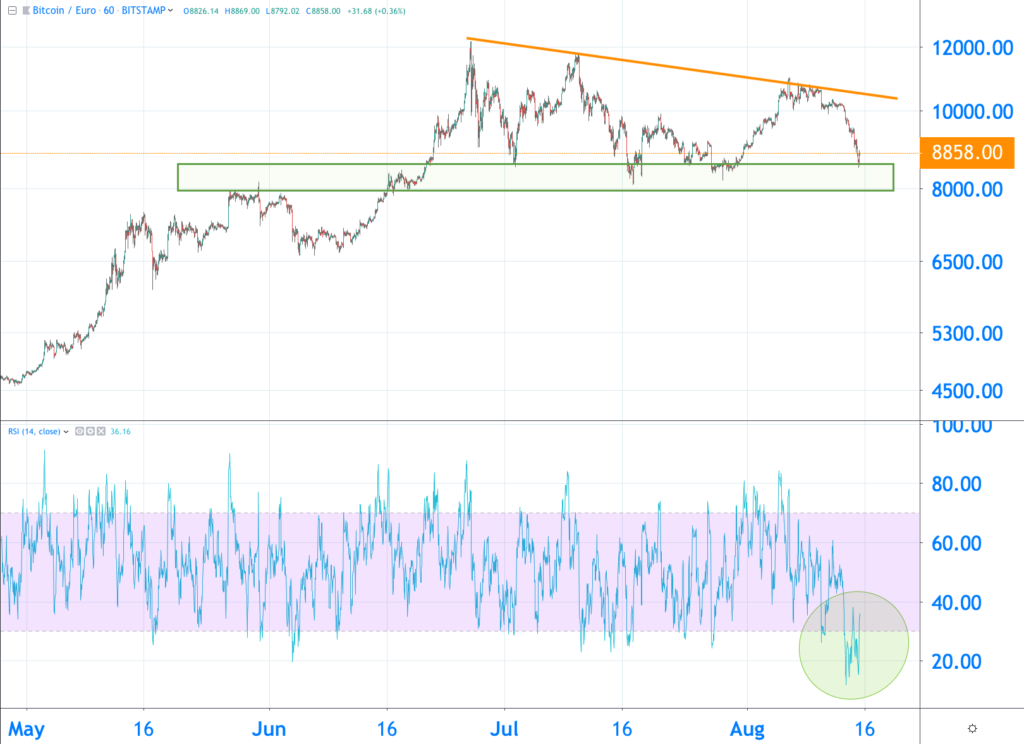
Above you see the symmetrical triangle that we wrote about on Tuesday. Every green and every red candle represents 1 day.
On Tuesday the course was still moving in this formation, and the course could break out either up or down. The latter turned out to be true. We also wrote that there is a large support zone in the green bar, which is between 8,100 euros and 8,500 euros. The course has already tapped that zone.
Sold too much
You can see that well below. That orange line is the top of that symmetrical triangle and that green bar is again a support zone. In the graph we have also included the RSI, that is the blue line, and it normally moves in the lilac-colored bar. This is an indicator that indicates whether bitcoin is overbought or oversold. Above 70 is overbought and below 30 is oversold.
In other words, too much is being bought or sold too much too quickly. At this moment the blue line is below the RSI, and that means that bitcoin is oversold. You can interpret this as saying that a lot has to be bought very quickly to get an RSI value between 30 and 70 again.
Price shows similarities with 2017
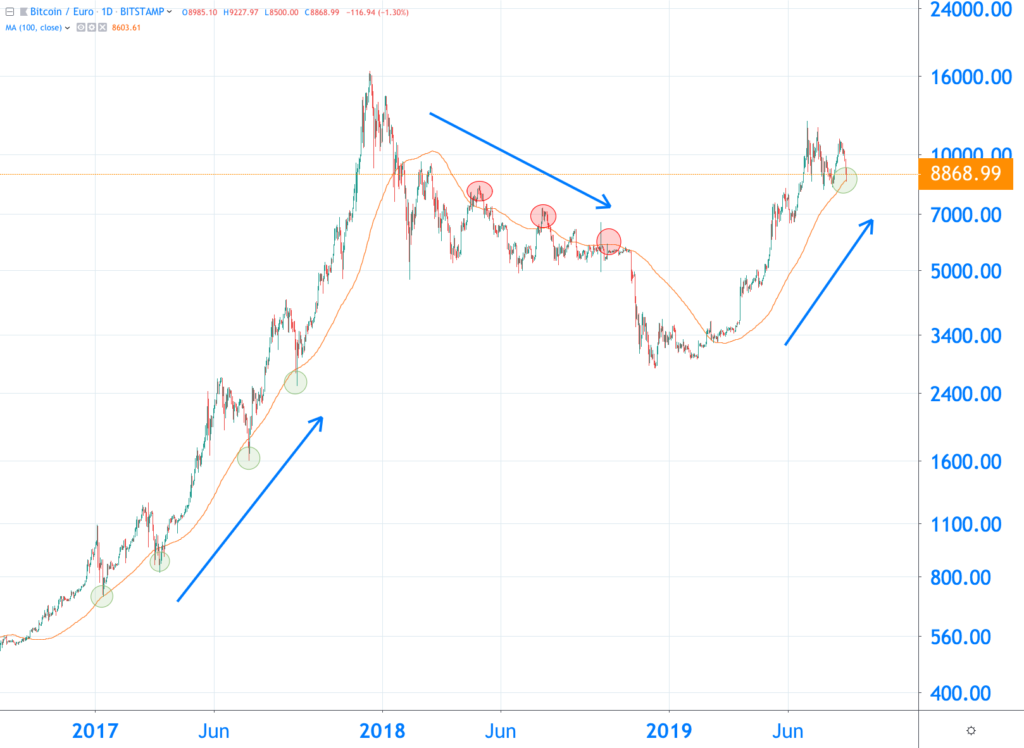
Is the world going down? Are we all a bobbin? That is a good question, but it lacks perspective. You get a perspective by learning from the past. In the graph below you can see the bitcoin rate from 2017.
To illustrate that there is a dip, we look at the moving average of 100 days. This is an indicator that looks at the average rate for the past hundred days. The orange line in the graph is 100 MA.
In the 2017 bull run you can see that the price falls below the 100 MA four times and then finds support from the 100 MA again. This is indicated by the green dots. During the bear market of 2018 this is the other way around, the red balls indicate that the price has risen above 100 MA three times in that year. Then the course finds resistance again from that orange line.
The last green ball is this week’s dip, for the first time, the price has fallen just under 100 MA. Interpret this as you want, but the past teaches that this is part of it.
Now the question is, is the decline a reason for you to sell your bitcoin? Or do you see this as an opportunity to accumulate bitcoin (crypto snake for purchase)?
Related posts:
 GitHub Libra Code draws criticism from users
  Tipping on Reddit and Vimeo in BAT introduced by Brave
  Newcomers to the crypto market have to pay attention to scams and pump and dumps
  Hardly any growth in downloaded crypto apps, despite tripling price bitcoin
  Bloomberg accepts Bitcoin – says cryptomonads are here to stay
  The Central Bank can release their cryptocurrencies earlier than expected


