


This year Bitcoin again pleases us with a high yield. During such periods, cryptocurrency investors have pleasant troubles: how to increase the value of the portfolio not only in dollars, but also in bitcoins?
There are several strategies for solving this far from simple task, among the main ones:
- active trading with a pair of BTC / USD;
- investing in promising altcoins with relatively small capitalization;
- constant transitions from bitcoin to altcoins and back.
In this article we will try to understand the movement of funds between Bitcoin and Altcoins in order to find useful patterns.
Are the correlations unique?
The community often speaks of a high correlation between the main crypto active assets. Surely you have often met similar tables:
The correlation matrix shows the correlation coefficients between random variables. The correlation coefficient is an indicator of the strength and directionality of the linear dependence of two random variables.
In our case, these are the prices of two coins. The coefficient takes values from -1 to +1, where 0 means no linear dependence, +1 – prices change by the same percentage and in one direction, and -1 – prices change by the same percentage, but in opposite directions.
This matrix allows us to draw several practical conclusions:
- prices of top cryptocurrencies are very interrelated;
- Due to the high correlation between the presented coins, the possibilities of diversifying the portfolio made up of these assets are extremely limited.
Does this mean that it is enough to buy Bitcoin and, say, the broadcast, and not try to take active steps? For many passive investors and for beginners, such a strategy at a distance will help save time, nerves and significantly reduce the number of errors. However, experienced market participants need something else.
The correlation matrix is useful, but it hides some of the information. Indeed, the prices of most cryptocurrencies to the dollar are tied to the dynamics of Bitcoin prices, but the growth of the first cryptocurrency in most cases is not synchronous with the growth of its pursuers, which means that with a correct assessment of the situation, there is the possibility of additional earnings.
Communicating vessels
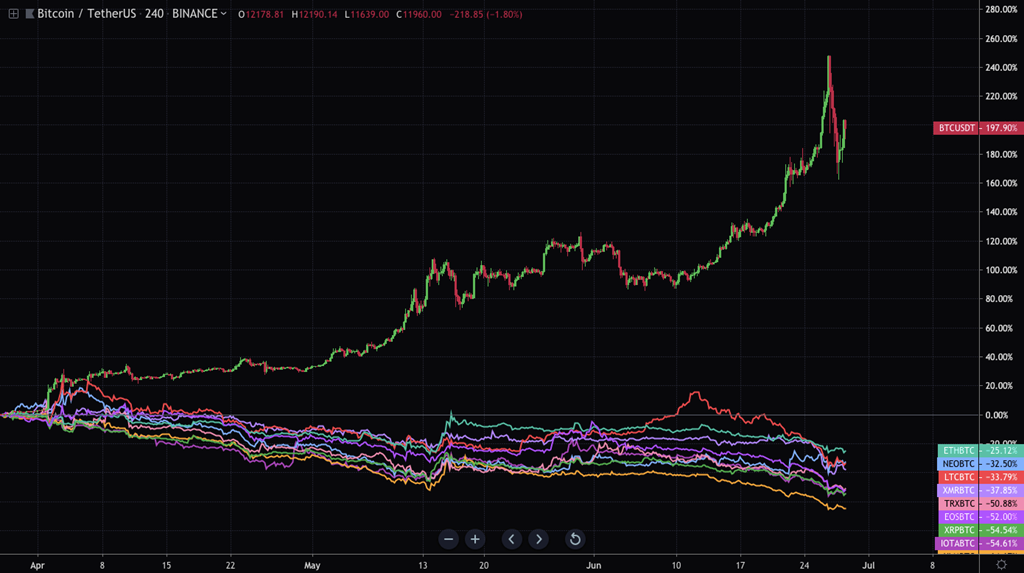
Have you noticed how, at the moments of the manifestation of strength and readiness of Bitcoin for the next roll, the altcoins quietly stand in the shadows, their price in USD freezes at the same level or even drops. Bitcoin literally sucks money from the rest of the coins, creating the effect of a tsunami, when an ebb occurs before a large wave. When the cast is completed, and Bitcoin takes a pause, the Altcoins quickly reduce the backlog. This pattern was observed in periods of a bull market at the end of 2017 and in the first half of 2019. For better understanding, let’s turn to the chart, where we compare a pair of BTC / USD with the prices of top altcoins paired with BTC:
On the chart you can see how money flows from altcoins to bitcoin and back. (The clickable chart can be viewed here. It is easy to make it in your TradingView account, just add the necessary assets via the “Compare” button in the “Graph” mode.)
The logical question is how to put this into practice? Cash flows can be used as an additional indicator when determining the strength and directionality of the bitcoin price. At the moment, especially in periods of high volatility, it is not always possible to accurately assess the state of affairs, however, there are situations in which such a schedule may be useful.
Consider the first application, highlighting several areas on the chart:
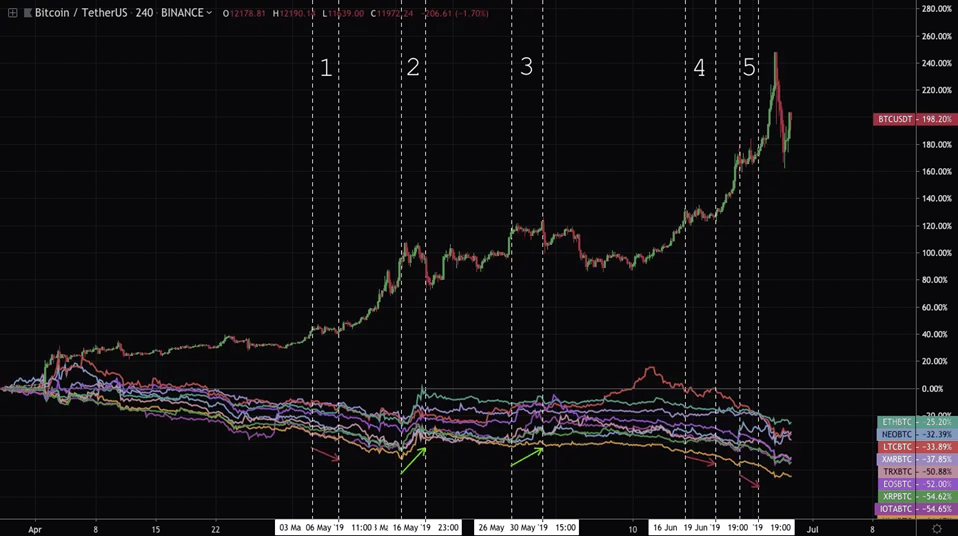
How these areas are similar: they all follow the rise in the price of Bitcoin, and over their length, the cryptocurrency is traded in the sideways or slightly adjusted.
Differences:
- 1,4,5 – Altcoins become cheaper relative to BTC (indicated by arrows at the bottom of each area);
- 2.3 – Altcoins are becoming more expensive relative to BTC.
The most important thing here is what happens next:
- 1,4,5 – Bitcoin continues to grow;
- 2,3 – bitcoin goes for correction.
How can this be explained in terms of cash flow:
- 1,4,5 – money continues to flow into Bitcoin, heating up the next impulse;
- 2,3 – the money is poured into the Altcoins, which are sharply fired, and then go to the correction along with the first cryptocurrency.
There are several more observations:
| BTC / USD | General Altcoin / BTC Trend | Bitcoin strength rating | Comment |
| Growth | The fall | BTC signal strength | These are the most common combinations when BTC / USD and Altcoins / BTC move in different directions. IMPORTANT! The main difficulty of such situations is that at the beginning of growth (fall) and before the turn, the multidirectional movement will remain. Here you should pay attention to the slope of the Altcoins / BTC charts (flat at the beginning and sharp before the turn) and the current BTC overbought / oversold. |
| The fall | Growth | BTC weak signal | |
| Lateral movement | Growth | BTC weak signal | An example is discussed above. At the time of the Bitcoin respite, by the movement of money from / to BTC, one can estimate the strength of the first cryptocurrency and the direction of its further movement. |
| Lateral movement | The fall | BTC signal strength | |
| Growth | Growth | BTC weak signal | It is often observed during BTC rebounds in the correction phase, accompanied by an increase in bitcoin without volumes and a simultaneous increase in altcoins against BTC. Signal to continue the correction. |
The remaining combinations are much less common.
This article is based on simple market observations. In the continuation of the analysis, you can go into details, consider patterns on different timeframes, market conditions, and even calculate the percentage of forecast accuracy. For now, let’s fast forward to review the cryptocurrency boom of the end of 2017 in the context of our article.
A look into the past
On the way to $ 20,000 in 2017, money was constantly moving between Bitcoin and Altcoin, forming similar patterns:
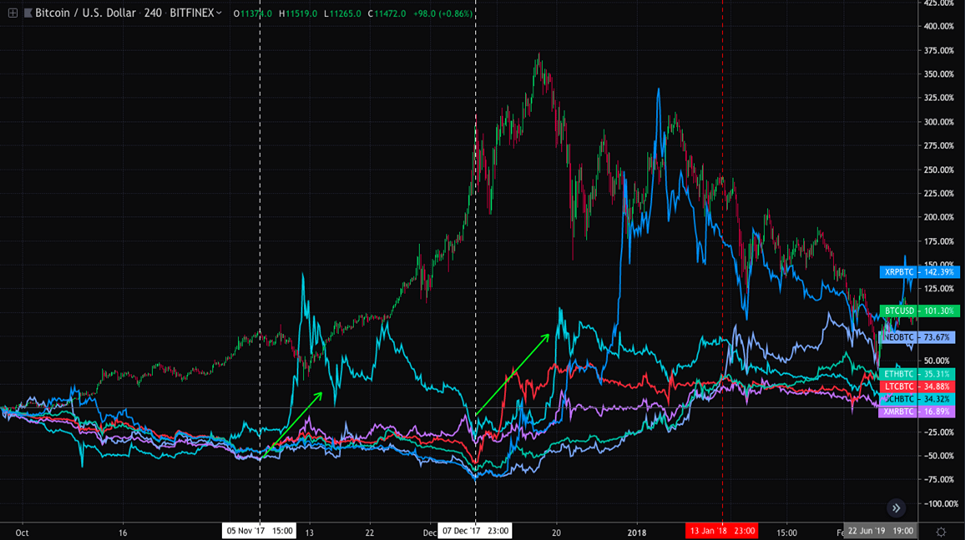
After December 7, when Bitcoin went for a temporary correction, the Altcoins no longer follow the usual multidirectional movement. Despite the growth of the first cryptocurrency, they continued to strengthen in conjunction with BTC. And as indicated in the table above, this can be regarded as a sign of Bitcoin weakness. Further, closer to January 13, when the top Altcoins for the most part began to go out in relation to BTC, the market finally collapsed.
It would be naive to expect that events will evolve according to an identical scenario, but it is important to note that when there is a violation of the different directions of BTC / USD and altcoin / BTC charts, you must be especially careful.
Conclusion
The described observations can help in analyzing the current state of the market and the strength of the first cryptocurrency. For active traders, they can be useful in constant switching between Bitcoin and Altcoins. Remember that this indicator can not be the only factor in making decisions; it should be used as a tool to complement your vision of the situation.
Author: Sergey Vasin, Operations Director Blackmoon.
Related posts:
 GitHub Libra Code draws criticism from users
  Tipping on Reddit and Vimeo in BAT introduced by Brave
  Newcomers to the crypto market have to pay attention to scams and pump and dumps
  Hardly any growth in downloaded crypto apps, despite tripling price bitcoin
  Bloomberg accepts Bitcoin – says cryptomonads are here to stay
  The Central Bank can release their cryptocurrencies earlier than expected


