How to download the latest version
On the OpenHardwareMonitor.org website we can download the 0.8.0 Beta version, but it is only compatible with devices with Intel Sandy Bridge and earlier. However, as we said before, the community has continued to add support for new hardware and have developed later versions. Currently, we have version 0.8.0.3 Alpha, which although we can download it from the project website itself, is hidden and if we do not have the link we cannot access it.
So here you have the link to download OpenHardwareMonitor 0.8.0.3 Alpha. There is also the development page on Github if you are interested in seeing how it goes.
How to install and configure OpenHardwareMonitor
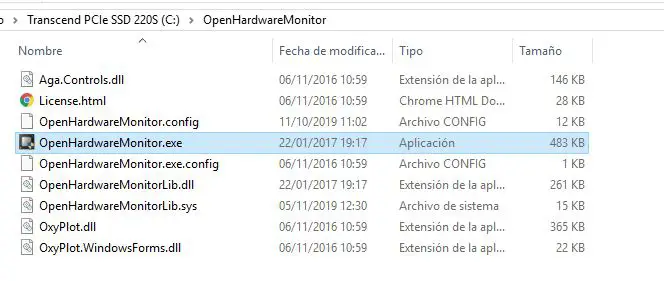
For starters, OpenHardwareMonitor is not installed. In other words, we download a ZIP file and unzip it in the folder we want from our team, and we will execute it from there.
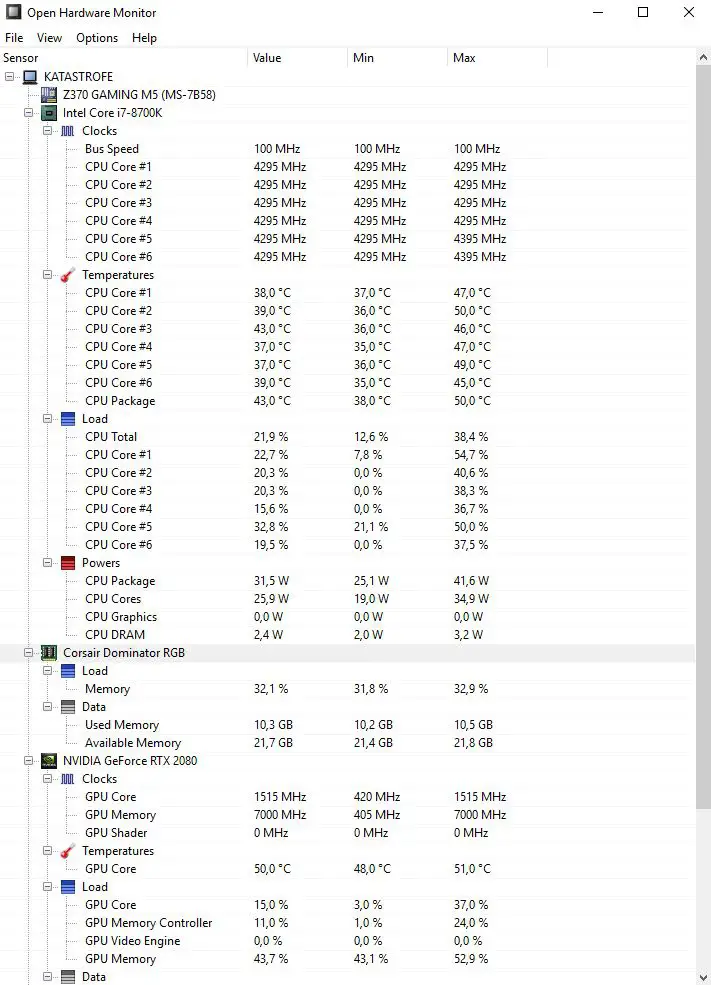
Once we open the application, a window will open with (potentially) dozens of data lines: processor speed, temperature of each core, load, RAM, graphics card, hard drives, etc.
- Rename: to change the name to the sensor.
- Hide: hides it from view.
- Pen Color: allows us to choose what color we want to take later in the graphics.
- Reset Pen Color: returns the color to the default one.
- Show in tray: add an icon to the taskbar that will show us the value of the sensor.
- Show in Gadget: also brings a gadget that will show us the sensors we want in summary mode.
In the fans that are PWM controlled by the motherboard, or in the graphic fan if it allows it, we also have the “Control” option, which will allow us to configure the fan speed from here manually.
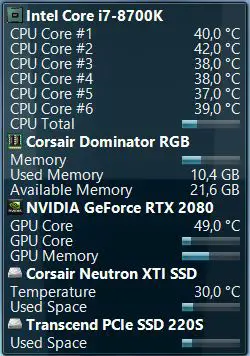
The OpenHardwareMonitor gadget
The gadget is one of the most interesting options. To see it, we must go to the “View” menu and mark “Show Gadget”, and a window will appear with the sensors that we have marked so that they are displayed in a rather aesthetic way. In addition, it has the old-fashioned format of Windows 7 gadgets, and will appear on the desktop in the background although we can dial to always show up on the rest (right button -> Always on top).
Temperature graphs
This software also allows us to see graphs of temperature, or of the value that we select. To do this, click on the View menu, and select «Show Plot». We will see how the window changes and will allow us to select the sensors that we want to appear.
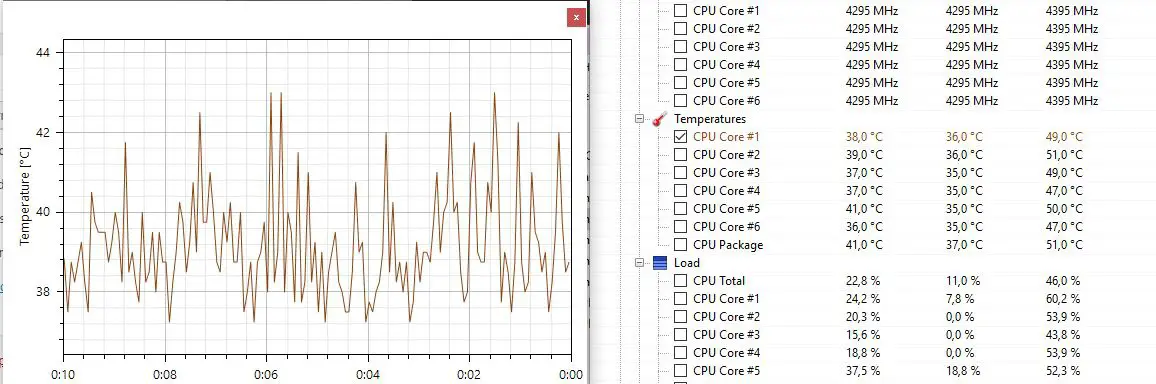
Likewise, here we can right-click on the graph and change the time we want to be displayed, which ranges from 5 minutes to 24 hours.
Other additional options
OpenHardwareMonitor gives us even more options, within the Options menu.
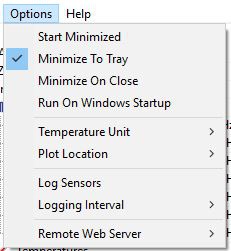
- Start minimized: that the application minimized start, will appear as an icon in the start bar.
- Minimize to tray: when we press the minimize button, instead of being in the start bar, it will remain as an icon.
- Minimize on close: when we press close, it will be minimized instead.
- Run on Windows startup: so that the program starts automatically when we turn on the PC.
- Temperature unit: allows switching between degrees Celsius and Farenheit.
- Plot location: allows you to change the way in which the graph is displayed (window, bottom or right).
- Log Sensors: shows a log of the sensor measurements.
- Logging Interval: here we configure the interval in which it collects data from the sensors for the log.
- Remote Web Server: Here we can configure a web server to access data remotely.
That is all. As you can see, this software is a very complete and also free monitoring tool, so it is highly recommended to be able to control the temperature, voltage and other parameters of our equipment.
Related posts:
 7-nanometer Nvidia GPU, TSMC will handle most of the production
  ASRock X299, a new BIOS allows you to install 2 TB of memory
  MSI Prestige X570 Creation Review: Test | Specs | Hashrate
  Radeon RX 5500 XT, PCI Express 3.0 castrates performance?
  An overclocker ran 1TB of RAM on an X299 motherboard limited to 256GB
  Best Review 2021: MSI MPG X570 Gaming Edge WiFi Under $250 ($200)