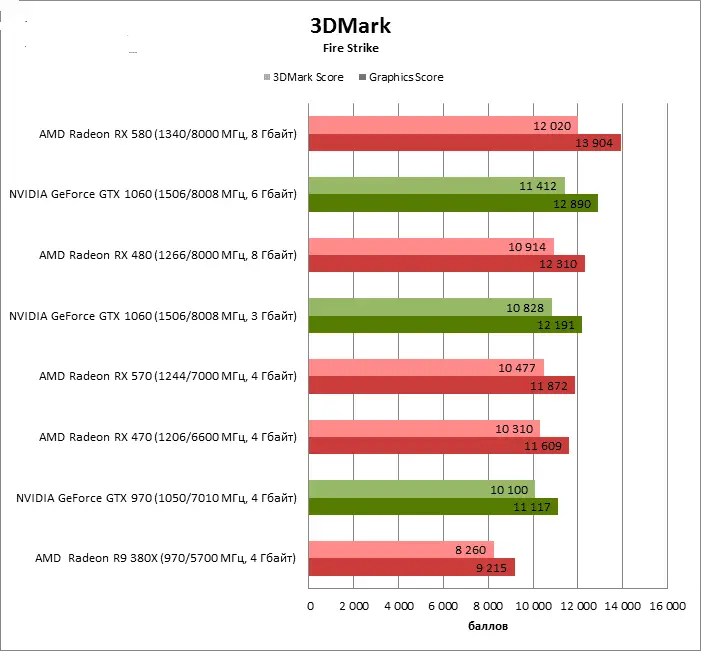
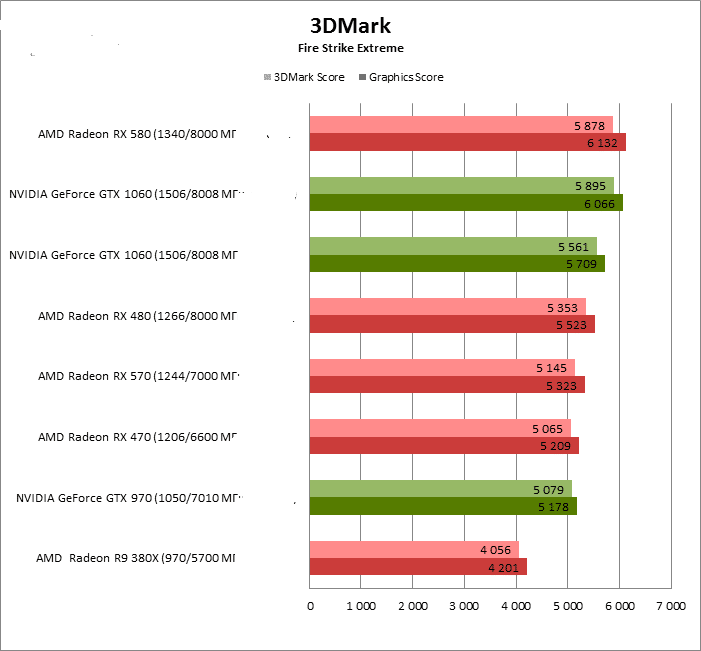
Performance: 3DMark
According to the results of synthetic tests, it is obvious that the power limit, increased in the Radeon RX 570 in comparison with the RX 470 by 30 W , does not give the new product a practically significant advantage. The difference in points between RX 470 and RX 570 corresponds to a 3% difference in maximum GPU frequency, that’s all.
Among other test participants, the Radeon RX 480, GeForce GTX 970 and GeForce GTX 1060 with 3GB of RAM are also nearly equivalent to the Radeon RX 570 in 3DMark, with a margin of 5% up or down.
On the other hand, there are video cards of the Radeon R9 380X class, over which the RX 570 has a confident advantage both in speed and in power consumption, as well as significantly more productive models of the new generation – Radeon RX 580 and a full-fledged GeForce GTX 1060.
| 3DMark (Graphics Score) | |||||||||
|---|---|---|---|---|---|---|---|---|---|
| Resolution | AMD Radeon RX 570 (1244/7000 MHz, 4 GB) | AMD Radeon R9 380X (970/5700 MHz, 4 GB) | AMD Radeon RX 470 (1206/6600 MHz, 4 GB) | AMD Radeon RX 480 (1266/8000 MHz, 8 GB) | AMD Radeon RX 580 (1340/8000 MHz, 8 GB) | NVIDIA GeForce GTX 970 (1050/7010 MHz, 4 GB) | NVIDIA GeForce GTX 1060 (1506/8008 MHz, 3 GB) | NVIDIA GeForce GTX 1060 (1506/8008 MHz, 6 GB) | |
| Fire strike | 1920 × 1080 | 11872 | 9 215 | 11609 | 12 310 | 13904 | 11 117 | 12,191 | 12 890 |
| Fire strike extreme | 2560 × 1440 | 5323 | 4 201 | 5209 | 5 523 | 6132 | 5,178 | 5709 | 6,066 |
| Fire strike ultra | 3840 × 2160 | 2628 | 2 123 | 2626 | 2 701 | 3,032 | 2467 | 2 708 | 2 891 |
| Time spy | 2560 × 1440 | 3639 | 2817 | 3569 | 3953 | 4,202 | 3511 | 3811 | 4 107 |
| Max. | −19% | −0% | + 9% | + 17% | −3% | + 7% | + 14% | ||
| Average | −21% | −2% | + 5% | + 16% | −5% | + 4% | + 11% | ||
| Min. | −23% | −2% | + 3% | + 15% | −6% | + 3% | + 9% |

Performance: Gaming ( 1920 × 1080 , 2560 × 1440)
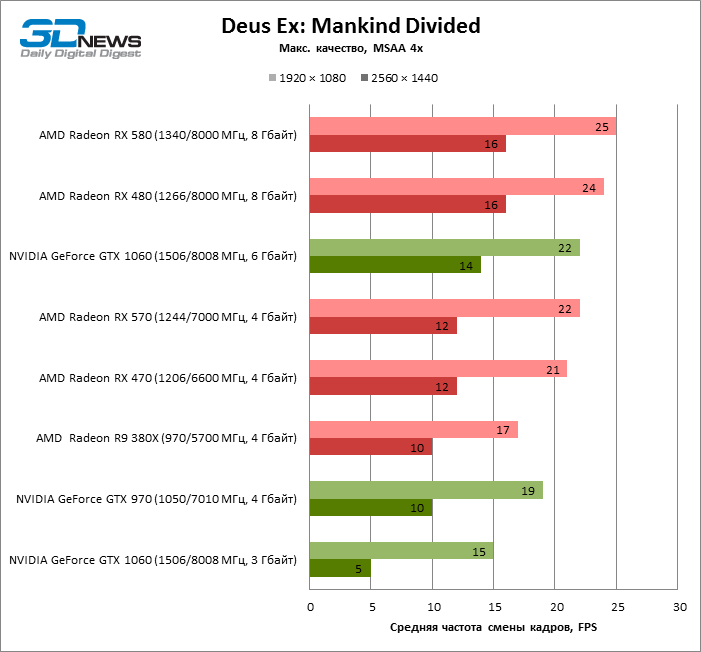
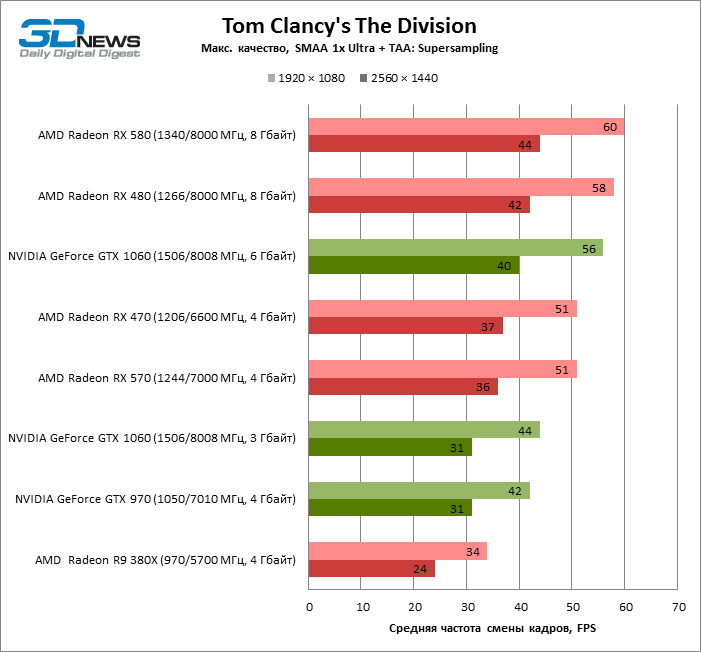
The test results in games are not as unambiguous as “synthetics”. The Radeon RX 570 is still difficult to distinguish from the RX 470, but the balance of power has changed when comparing the new product to other graphics cards in the AMD camp. In particular, the advantage of RX 570 over Radeon R9 380X sometimes reaches 49%, despite the same amount of RAM. On the other hand, the Radeon RX 480 and RX 580, which have twice the RAM, are 24 and 31% faster in some tests than the RX 570 even at 1080p, while at 1440p the difference reaches 37 and 42%, respectively.
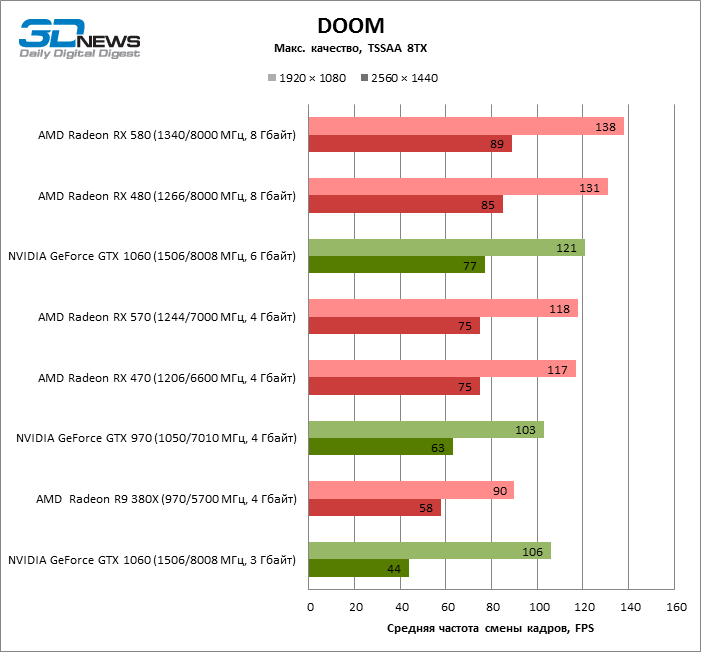
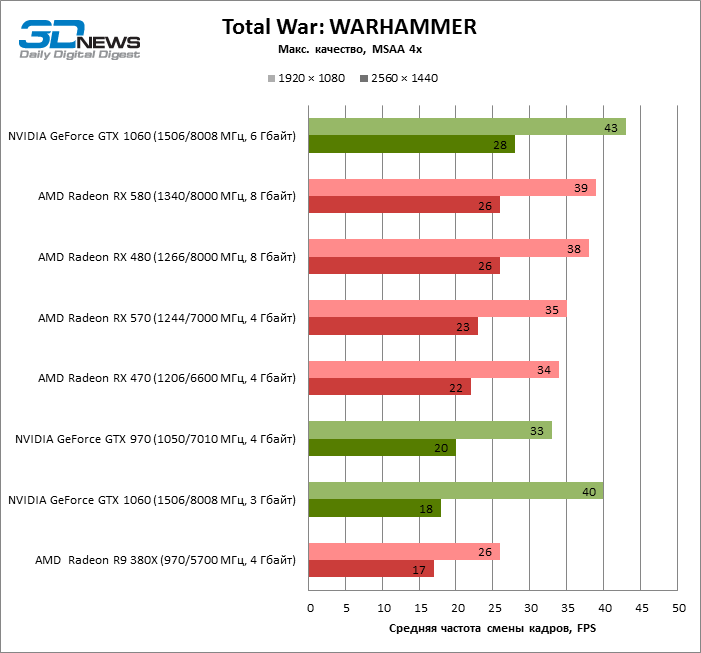
As for NVIDIA graphics cards, the current set of gaming benchmarks clearly demonstrates the differences between competing architectures as never before. Even the GeForce GTX 970, which is equivalent to the Radeon RX 570 in terms of RAM, surpasses its rival by 32% in some games, while in others, on the contrary, the RX 570 gains a 43% advantage. On average, there is an 8-10% advantage in favor of AMD.
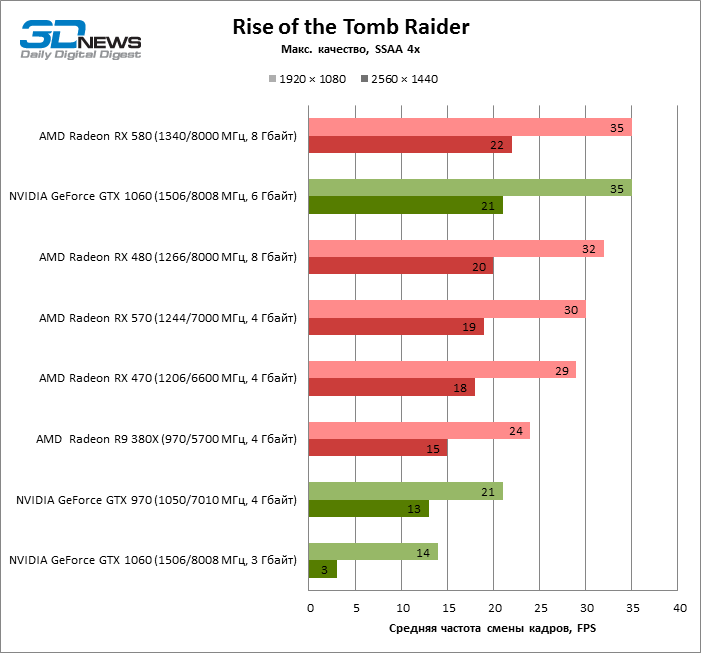
The confrontation between the Radeon RX 570 and the GeForce GTX 1060 with 3GB of RAM is complicated by the difference in the amount of RAM. In most tests at 1080p, the NVIDIA graphics card outperformed its main competitor, but games that lack 3GB of RAM minimize the advantage of the younger version of the GeForce GTX 1060 even in 1080p mode. At a resolution of 1440p with full-screen anti-aliasing, the GTX 1060 with 3 GB of RAM can already in rare cases compete with the Radeon RX 570, and indeed provide an acceptable frame rate.
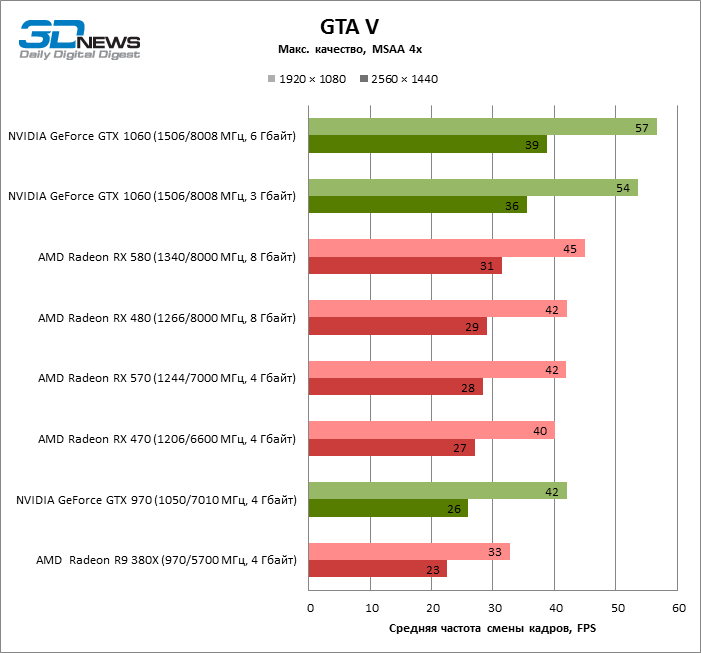
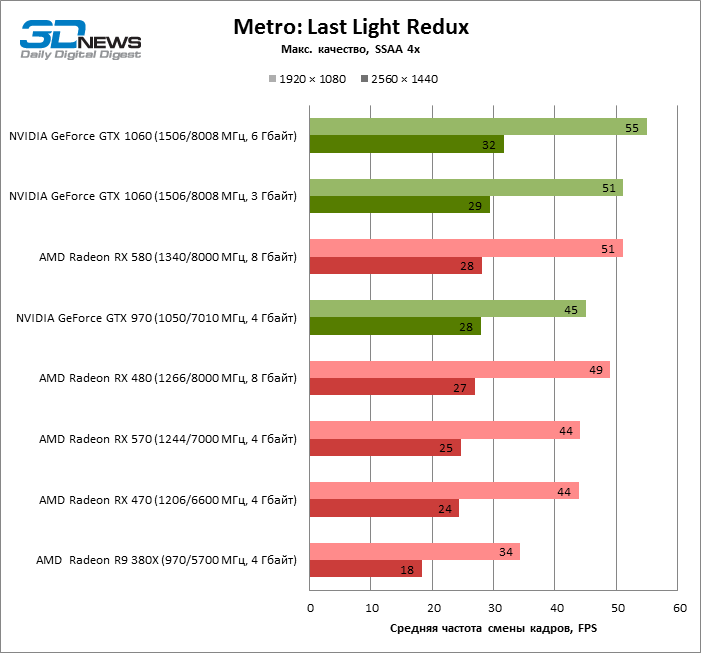
The full version of the GeForce GTX 1060 is not limited by the amount of memory in any graphics mode up to Ultra-HD, so its performance level is on average 20% higher than that of the Radeon RX 570. At the same time, there are tests in which the advantage of the GTX 1060 reaches 35-37 % depending on the resolution.
| 1920 × 1080 | |||||||||
|---|---|---|---|---|---|---|---|---|---|
| Full screen anti-aliasing | AMD Radeon RX 570 (1244/7000 MHz, 4 GB) | AMD Radeon R9 380X (970/5700 MHz, 4 GB) | AMD Radeon RX 470 (1206/6600 MHz, 4 GB) | AMD Radeon RX 480 (1266/8000 MHz, 8 GB) | AMD Radeon RX 580 (1340/8000 MHz, 8 GB) | NVIDIA GeForce GTX 970 (1050/7010 MHz, 4 GB) | NVIDIA GeForce GTX 1060 (1506/8008 MHz, 3 GB) | NVIDIA GeForce GTX 1060 (1506/8008 MHz, 6 GB) | |
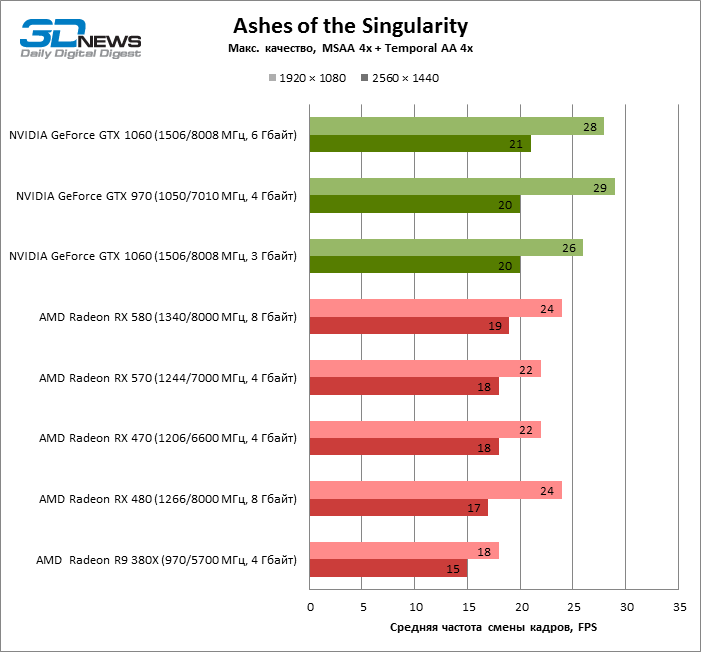
| Ashes of the singularity | MSAA 4x + TAA 4x | 22 | eighteen | 22 | 24 | 24 | 29 | 26 | 28 |
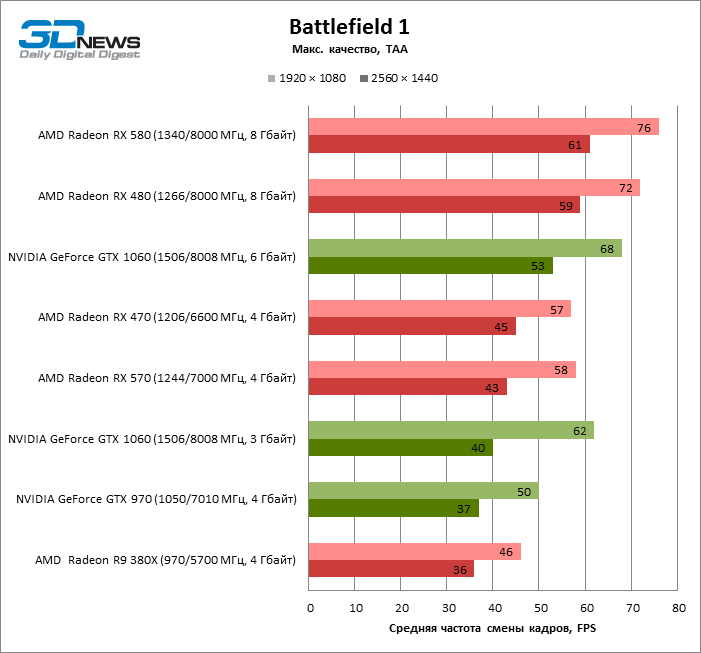
| Battlefield 1 | TAA | 58 | 46 | 57 | 72 | 76 | fifty | 62 | 68 |
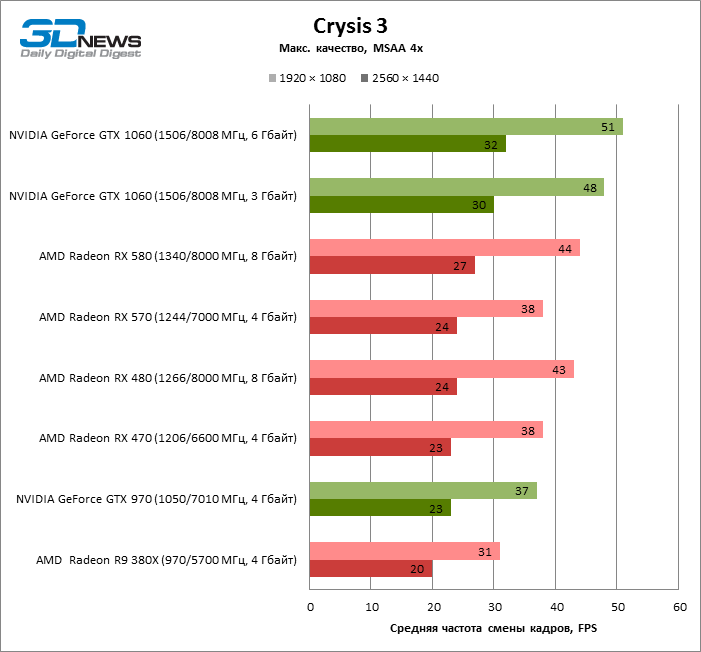
| Crysis 3 | MSAA 4x | 38 | 31 | 38 | 43 | 44 | 37 | 48 | 51 |
| Deus Ex: Mankind Divided | MSAA 4x | 22 | 17 | 21 | 24 | 25 | nineteen | fifteen | 22 |
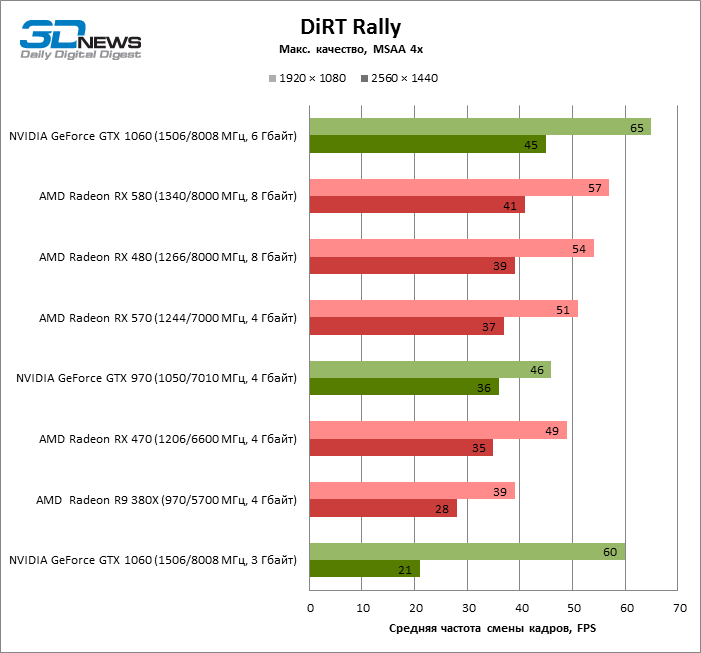
| DiRT Rally | MSAA 4x | 51 | 39 | 49 | 54 | 57 | 46 | 60 | 65 |
| DOOM | TSSAA 8TX | 118 | 90 | 117 | 131 | 138 | 103 | 106 | 121 |
| Gta v | MSAA 4x + FXAA + Reflection MSAA 4x | 42 | 33 | 40 | 42 | 45 | 42 | 54 | 57 |
| Metro: Last Light Redux | SSAA 4x | 44 | 34 | 44 | 49 | 51 | 45 | 51 | 55 |
| Rise of the Tomb Raider | SSAA 4x | thirty | 24 | 29 | 32 | 35 | 21 | fourteen | 35 |
| Tom clancy’s the division | SMAA 1x Ultra + TAA: Supersampling | 51 | 34 | 51 | 58 | 60 | 42 | 44 | 56 |
| Total War: WARHAMMER | MSAA 4x | 35 | 26 | 34 | 38 | 39 | 33 | 40 | 43 |
| Max. | −18% | + 0% | + 24% | + 31% | + 32% | + 28% | + 35% | ||
| Average | −23% | −2% | + 10% | + 15% | −7% | + 2% | + 20% | ||
| Min. | −33% | −5% | + 0% | + 7% | −30% | −53% | + 0% |
| 2560 × 1440 | |||||||||
|---|---|---|---|---|---|---|---|---|---|
| Full screen anti-aliasing | AMD Radeon RX 570 (1244/7000 MHz, 4 GB) | AMD Radeon R9 380X (970/5700 MHz, 4 GB) | AMD Radeon RX 470 (1206/6600 MHz, 4 GB) | AMD Radeon RX 480 (1266/8000 MHz, 8 GB) | AMD Radeon RX 580 (1340/8000 MHz, 8 GB) | NVIDIA GeForce GTX 970 (1050/7010 MHz, 4 GB) | NVIDIA GeForce GTX 1060 (1506/8008 MHz, 3 GB) | NVIDIA GeForce GTX 1060 (1506/8008 MHz, 6 GB) | |
| Ashes of the singularity | MSAA 4x + TAA 4x | eighteen | fifteen | eighteen | 17 | nineteen | twenty | twenty | 21 |
| Battlefield 1 | TAA | 43 | 36 | 45 | 59 | 61 | 37 | 40 | 53 |
| Crysis 3 | MSAA 4x | 24 | twenty | 23 | 24 | 27 | 23 | thirty | 32 |
| Deus Ex: Mankind Divided | MSAA 4x | 12 | 10 | 12 | sixteen | sixteen | 10 | five | fourteen |
| DiRT Rally | MSAA 4x | 37 | 28 | 35 | 39 | 41 | 36 | 21 | 45 |
| DOOM | TSSAA 8TX | 75 | 58 | 75 | 85 | 89 | 63 | 44 | 77 |
| Gta v | MSAA 4x + FXAA + Reflection MSAA 4x | 28 | 23 | 27 | 29 | 31 | 26 | 36 | 39 |
| Metro: Last Light Redux | SSAA 4x | 25 | eighteen | 24 | 27 | 28 | 28 | 29 | 32 |
| Rise of the Tomb Raider | SSAA 4x | nineteen | fifteen | eighteen | twenty | 22 | 13 | 3 | 21 |
| Tom clancy’s the division | SMAA 1x Ultra + TAA: Supersampling | 36 | 24 | 37 | 42 | 44 | 31 | 31 | 40 |
| Total War: WARHAMMER | MSAA 4x | 23 | 17 | 22 | 26 | 26 | twenty | eighteen | 28 |
| Max. | −16% | + 5% | + 37% | + 42% | + 14% | + 25% | + 37% | ||
| Average | −22% | −2% | + 12% | + 18% | −9% | −17% | + 20% | ||
| Min. | −33% | −5% | −6% | + 6% | −32% | −84% | + 3% |