


The time goes fast in cryptoland. Bitcoin was on its way to $ 14,000 ($ 12,200) last week, on Wednesday, June 26. The highest point of 2019 was then reached. At the time of writing, bitcoin is worth thirty percent less than the peak.
More often a correction of 30 to 40 percent
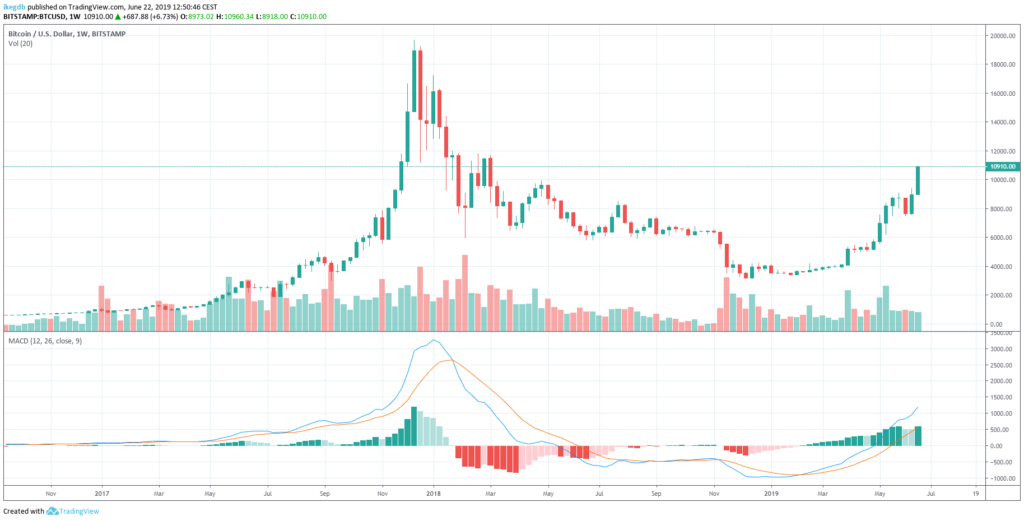
Bitcoin has fallen by more than thirty percent at the weekly level. At first glance, this seems quite intense. But is that true? To answer this question we zoom out a lot. You now look at the graph from mid-2016 to now. This graph shows a large part of the last bull run.
A course never just goes up. That is because investors take their profits on some points. The rate then makes a correction. These corrections also occur in a bull market. It seems that this is now also the case with bitcoin.
The graph below shows that bitcoin experienced no fewer than six major corrections in 2017. The value of bitcoin sometimes dropped from thirty to forty percent! In the meantime, bitcoin rose by more than 4,200 percent. In the long term, bitcoin was well on its way.
Does a strong trend line provide support?
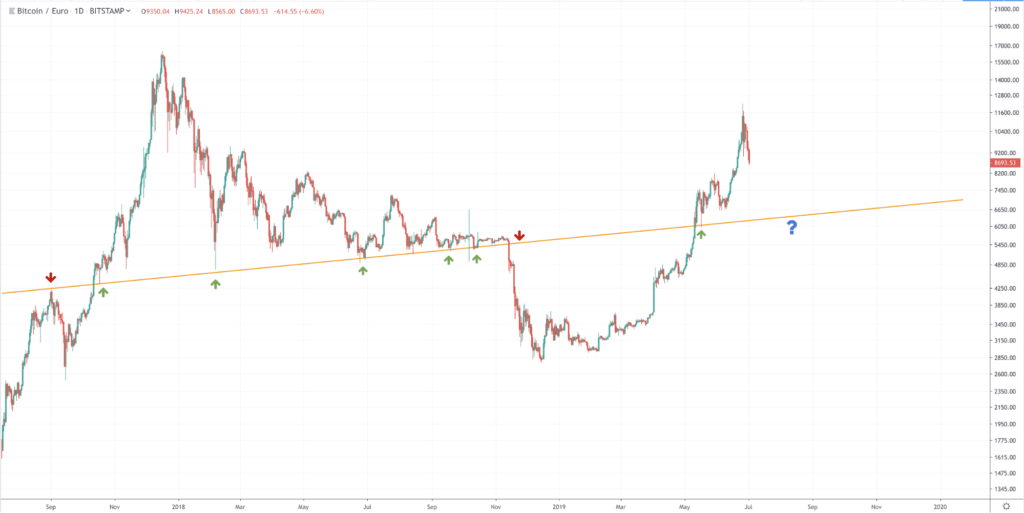
The question is now: when does the correction stop? One of the options is that the bitcoin course will look for an old trend line. In the graph below we have drawn this trend line in orange. By the way, we have zoomed in again, the graph shows the course from September 2017 to the present.
This trend line was a strong support throughout 2018. With the green arrows the course bounced upwards. Until November 2018, when bitcoin dropped in value.
The price rose above the trend line on 11 May. The bitcoin course tested this trend line and then shot up.
Is bitcoin looking for the orange trend line again now? In that case, bitcoin decreases by 48 percent compared to the last summit.
Short term also has a trend line
It rhymes, so it’s true. You can also draw a trend line for the short term. The graph below is therefore somewhat zoomed in again. You look at the bitcoin rate from March 25 to today.
We draw the trend line again in orange, simply because it is a cheerful color. You can see that the bitcoin course has touched this line several times.
In the graph below you can also see what happened last week. Bitcoin reached nearly 14,000 dollars (12,200 euros), but then fell. The course then found support on the red bar and seemed to be recovering. Nevertheless, the price fell through this zone, and bitcoin is now worth less than 10,000 euros.
At the moment, bitcoin appears to be moving towards the orange trend line and towards the green bar. This is an old resistor that can serve as support.
What do we expect from the bitcoin rate?
In the graph below we have combined both trend lines. The light orange trend line is the line of the short term, the blue line is that of the long term. You can also see the resistance zones (in red) and the support zone (in green).
Bullish
Is the bitcoin rate rising? Then the resistance zone must first be bridged. This zone is between 9,350 euros and 9,500 euros. If the bitcoin succeeds in rising further, the old summit of 12,200 euros is an important resistance.
Bearish
But if the rate falls correctly, there are different levels that are important. First, the trend line in the short term. In that case the value drops to around 8,500 euros.
Bitcoin can also find support on the green rectangle, then the value drops to 8,200 euros. One of these two scenarios corresponds to the “usual” corrections of thirty to forty percent that we discussed earlier in this article.
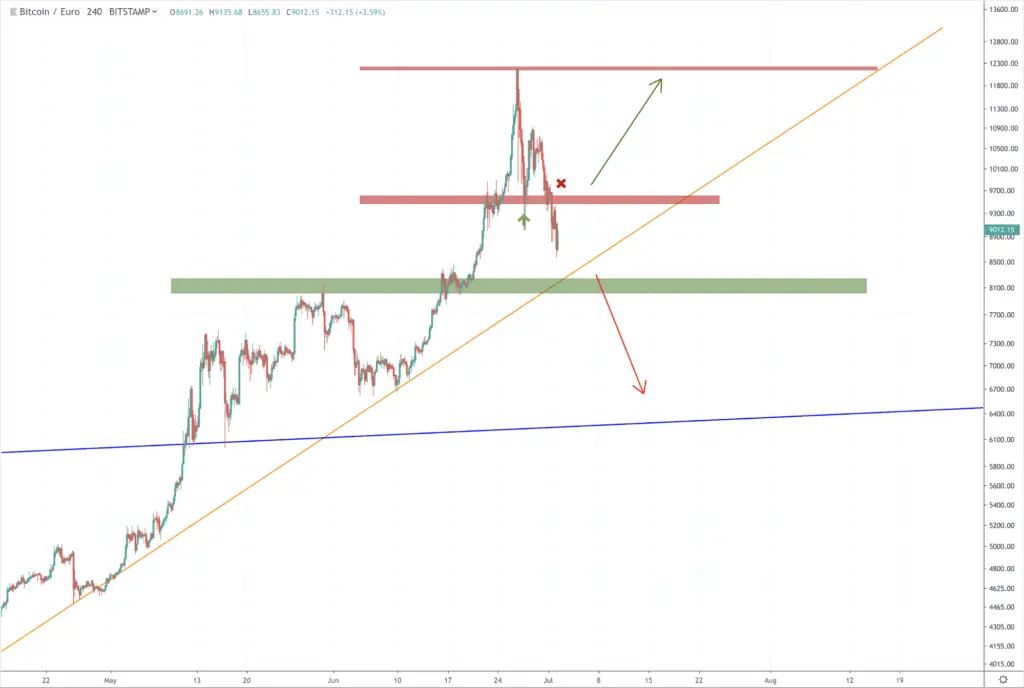
Is bitcoin falling even further? In the most pessimistic scenario, bitcoin looks for the old trend line. Bitcoin then drops to around 6,400 euros.
Related posts:
 Why do cryptocurrency Exist – Institutions
  Bitcoin and independent property rights
  NASDAQ on market manipulation: Everyone is now talking about regulating bitcoin and cryptocurrency
  Pilot Porsche on Ethereum blockchain to trace provenance materials
  Xfers from Singapore is going to use blockchain Zilliqa
  Make your own tokens with the Guarda wallet


