


The price of bitcoin behaves like the author of this article. When he can be found in the snack bar, he cannot make a choice either. In fact, there has been no clear trend since July, is the price of bitcoin going up or down in the longer term?
No time to read today? Then you have no excuses, Axel will explain it to you in a few minutes:
Bitcoin postpones outbreak
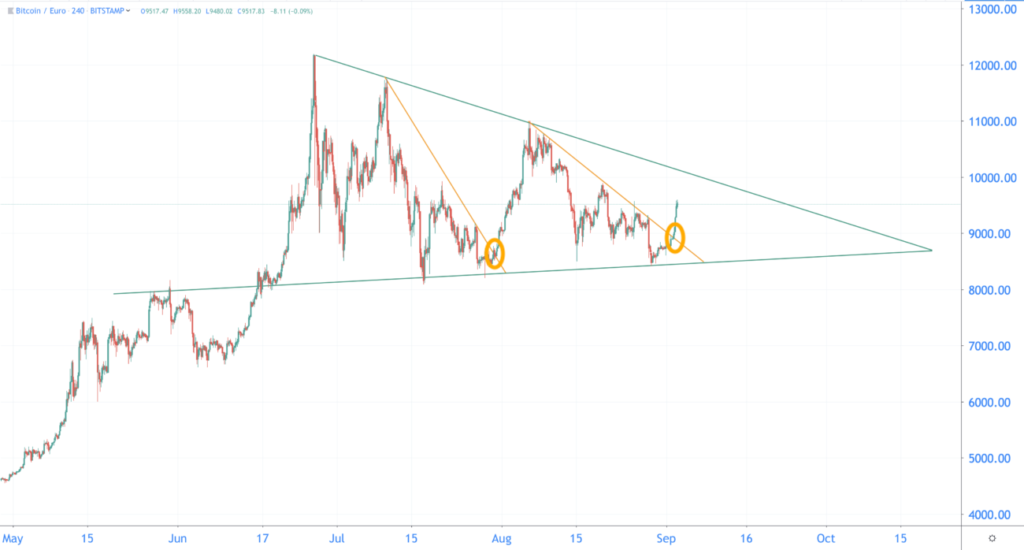
It is now becoming a meme, but as long as it remains relevant, we will continue. Have you read our previous analyzes? Then you know what we are talking about. You probably know the graph below. Each candle on the graph represents four hours:
The price of bitcoin moves between two trend lines. The movements keep getting smaller, until the course breaks out. That means that the course makes a big move when it comes out of the lines. But is that at the top or at the bottom? We have been waiting for that for a while. Come on, bitcoin!
The cause of the rise this week
The week started well for bitcoin! On Monday the rate suddenly rose by eight percent, as we wrote about in our previous analysis.
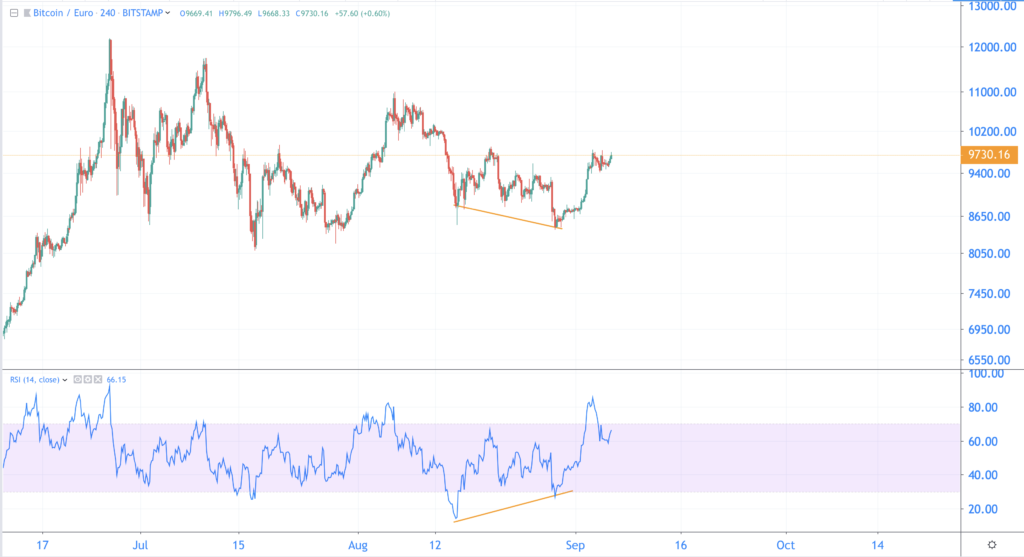
We wrote that the price of bitcoin was broken from a trend line, that was what it looked like then:
But there was something else going on, and that is negative divergence. This is usually a precursor to a rise in the price.
In the case of negative divergence, the bitcoin rate has lower and lower bottoms. But an indicator shows higher and higher soils. Here it is the RSI, the Relative Strength Indicator. On the two graphs below you can see that depicted with the orange trend lines.
The negative divergence played out well, on Monday the rate rose by more than eight percent.
Times are different from May to July
We zoom out the graph a bit, each candle now represents one day. You look at the bitcoin rate from May 2018 until now:
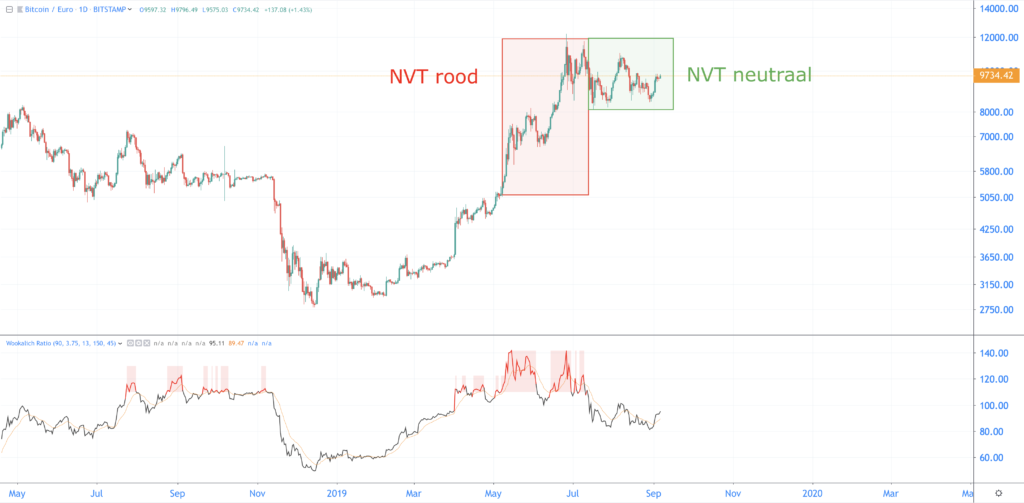
You probably remember it, from May onwards the bitcoin course shot up like a rocket. The sky seemed to be the limit, and many thought that bitcoin would reach the highest value ever before the summer.
But there was a snag in the form of the NVT indicator. In simple words, this indicator looks at the use of bitcoin in relation to the price.
In May to July, the NVT indicator turned red. This means that the value of all transactions was too low in relation to the bitcoin price. The increase then went unhealthily.
This is usually a precursor to a decline, as was also the case in November 2018. Luckily it didn’t come that far now, the rate found support at 8,500 euros.
At this moment the course is in a somewhat quieter waterway. We are now at about the same level as in July, but the NVT indicator is a lot lower. The value of bitcoin is therefore in a healthy relationship with the transactions on the blockchain.
The Moving Average as a safety net in a bull market
The price goes up in a bull market. But that is not possible without corrections, as the course sometimes has to take a breather. In that case, the value of bitcoin can decrease by 30 percent in a few days.
That is a bit of a shock, but it is part of it. The cryptomarket is still young, and that means that the price of bitcoin is still very volatile. Relatively little volume is needed for the course to make a considerable move.
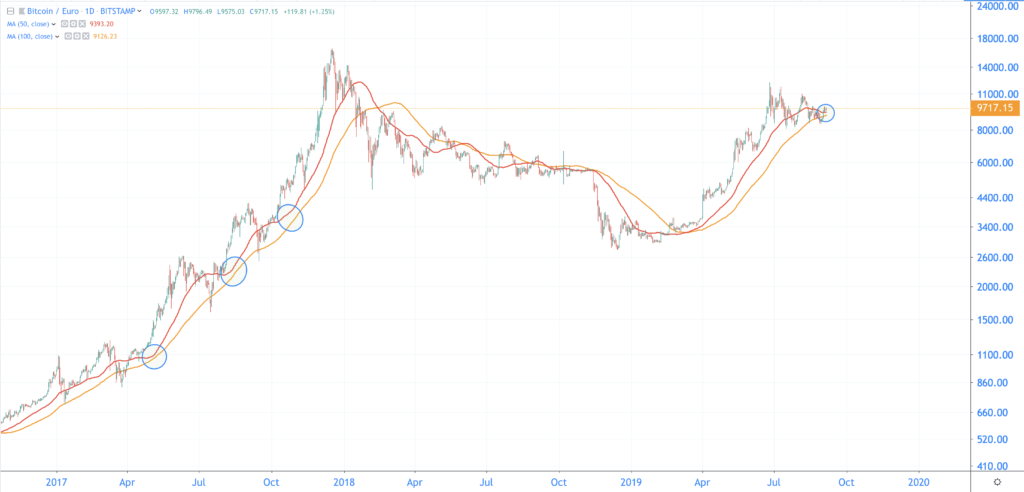
How do you determine when you can board after a correction? The Moving Averages can help you with this. A Moving Average (MA) displays the moving average over a certain period.
Usually the 50MA and the 100MA are used, in this case on a daily level. The red line on the graph is the 50MA, the orange line the 100MA. You can see that the price in the 2017 bull market has almost never fallen below 100MA. That was a different story in 2018, when we were in a bear market.
In addition, the 50MA in a bull market never falls below 100MA. That didn’t happen in the past few days either. So last week’s fall was a healthy correction in a bull market:
Where is the bitcoin course going now?
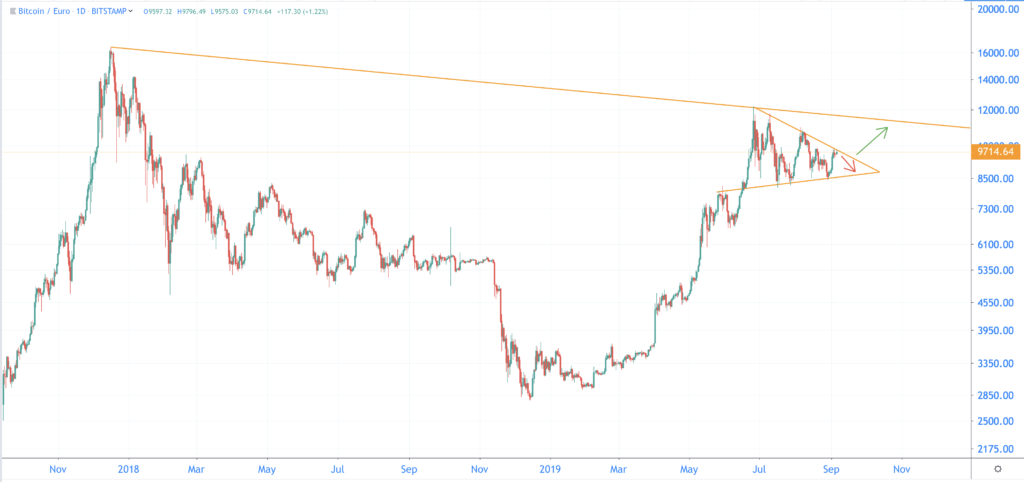
We’ve been talking about the triangle for weeks. But what happens if bitcoin breaks out of the triangle? Then it may be that the course finds resistance.
We draw a line across the 2017 summit (€ 16,500). This line also goes over the 2019 summit (12,185 euros). Is this trend line relevant? Then bitcoin finds resistance around 11,600 euros.
And what happens if bitcoin does not break out of the triangle again? Then you have to swallow, because then we will come back to it again on Tuesday. In that case we drop to the bottom of the triangle, which is now around 8,800 euros.
Related posts:
 GitHub Libra Code draws criticism from users
  Tipping on Reddit and Vimeo in BAT introduced by Brave
  Newcomers to the crypto market have to pay attention to scams and pump and dumps
  Hardly any growth in downloaded crypto apps, despite tripling price bitcoin
  Bloomberg accepts Bitcoin – says cryptomonads are here to stay
  The Central Bank can release their cryptocurrencies earlier than expected


