


The bitcoin course makes ever-smaller movements and seems to be getting closer to an outbreak. At the same time, altcoins seem to have difficulty joining bitcoin. In this price analysis we, therefore, focus not only on bitcoin but also on litecoin and ether. There we go!
Don’t feel like reading? No problem, Axel explains it to you in a few minutes:
There he is again!
Yes, we are still talking about the triangle. You can see it below on the graph. Each candle represents four hours:
The price of bitcoin is caught between two trend lines that seek each other out. Analysts often use a formation like this to determine a good buy or sell moment. Does the course touch the top of the triangle? Then it’s time to sell. The bottom is then a good buying moment, because that is a temporary bottom. But this is not buying advice, since this strategy is not without risk. You never know when the course breaks from the triangle.
Speaking of that, if bitcoin waits for the tip of the triangle, we’ll have to be patient for that big outbreak. Are we going up or down?
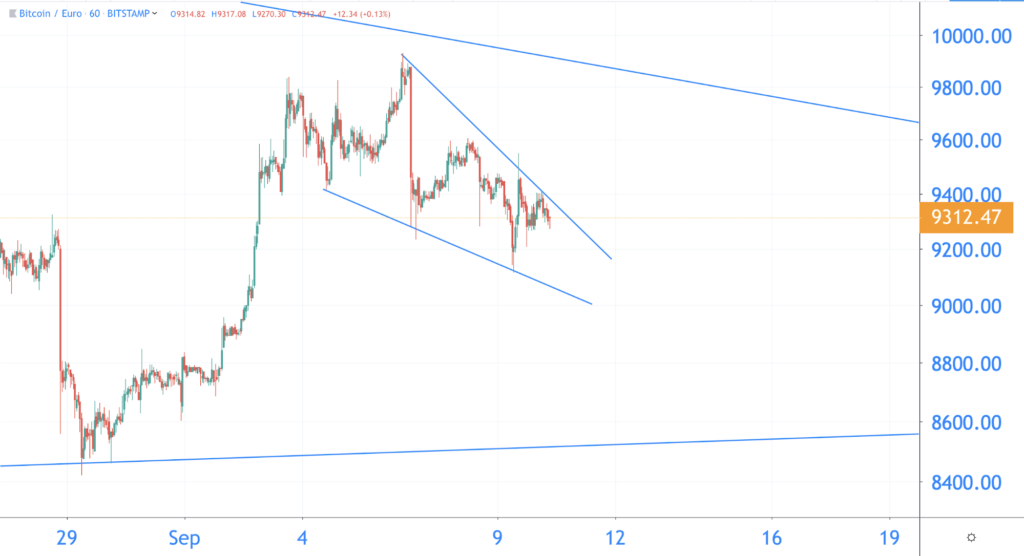
The falling wedge can cause new attempt outbreak
We zoom in even further on the graph. Each candle on the graph now represents one hour instead of four hours.
A falling wedge can cause a positive outbreak. Falling watt? A falling wedge is characterized by lower tops and lower bottoms. The price moves between two trend lines. The up and down movements are getting smaller. In most cases, a falling wedge causes an outbreak upwards.
Is bitcoin breaking out of the falling wedge? Then the course can make a new attempt to find the top of the large triangle. And just maybe you won’t hear anything about a triangle from us in the coming weeks.
Bitcoin course is actually still doing fine
If the graph is zoomed in far, it does not always seem to go well with the course. But as they say in English: when in doubt, zoom out! Or “sell in May and go away.” But remember to come back in September. “Perhaps also applicable to bitcoin ?
The price of bitcoin is now still at a higher level than the support zone of 2018. In the graph below, the support is represented by the green bar.
The course did not easily fall below this green zone in most of 2018. Until November, when bitcoin broke through with great violence. The lowest price of 2018, 2,700 euros, was achieved on 15 December.
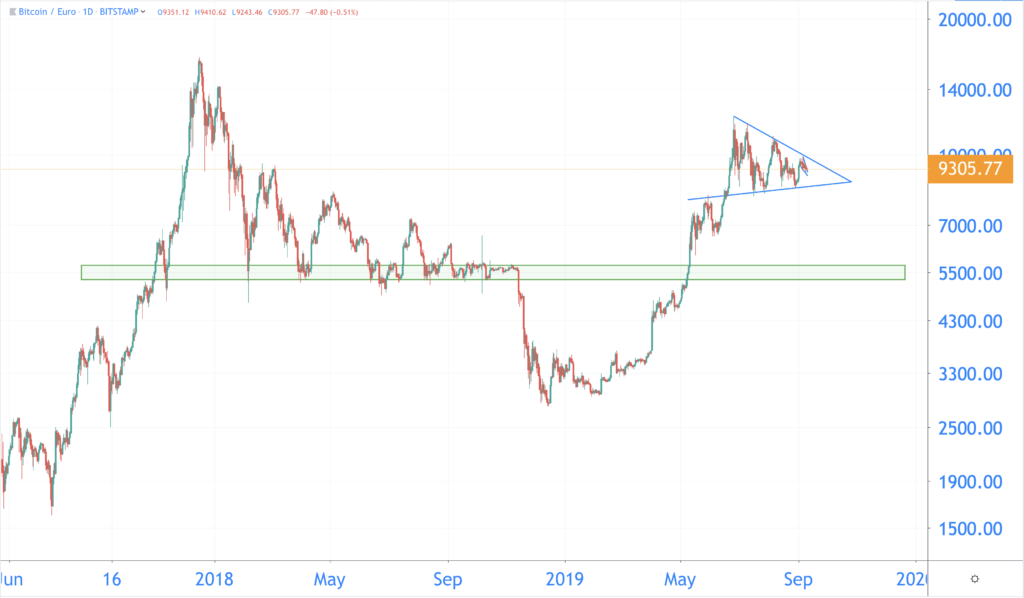
Actually it is quite an achievement that the bitcoin rate is now higher than the support for 2018. To be able to understand that, we must also look at other coins. There are quite a few, so we discuss two. We start with litecoin.
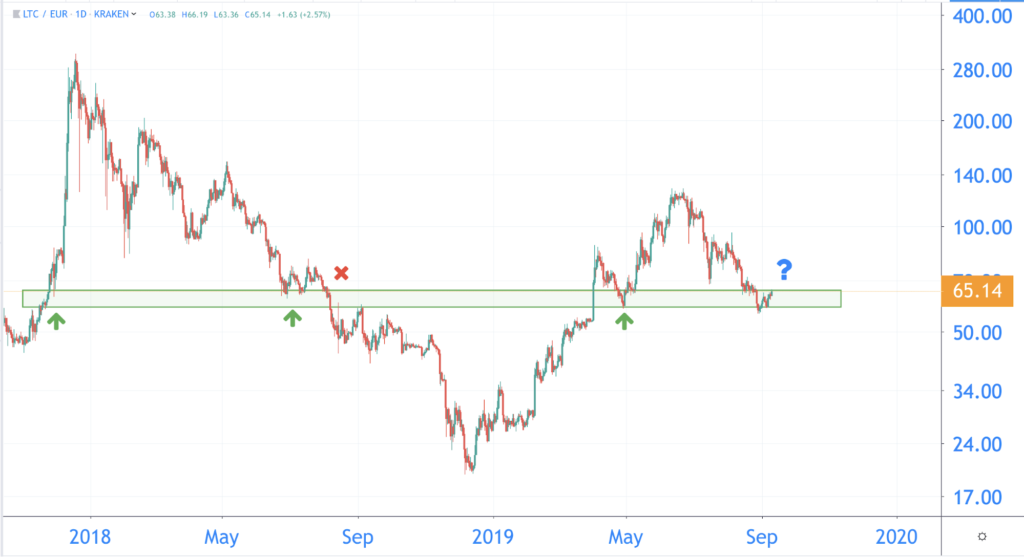
Litecoin back on major support zone 2018
Litecoin has a strong start in 2019. Up to and including June it was one of the best performing crypto coins of this year. The rate had risen by no less than 560 percent since the low of December 2018!
This is partly due to the hype surrounding the litecoin block halving. This means that the reward for miners is halved. Half the amount of litecoin is then available on the market every 2.5 minutes. With the same demand, the price can rise. We also saw this with the previous bitcoin block halvings, and to a lesser extent with the litecoin block halving.
The price of litecoin dropped considerably just before the halving. Probably investors have already calculated this moment. The price of litecoin had already risen before the litecoin block halving took place. Just before the halving the race collapsed again.
This also happened in 2015: the price rose in the months prior to the halving. However, a month before the halving, the rate started to fall. The recovery only followed in the following months.
The rate of litecoin is now exactly at the support zone of 2018. Unlike bitcoin, litecoin is therefore back on its feet.
In August 2018, litecoin fell below the green zone for the first time. The value made a pike dive towards 19.50 euros. The recovery soon followed. On April 2, the price of litecoin shot through the green bar. The resistance then became a support.
This zone is becoming important again. Will litecoin fall through support again, or will it soon find its way back up? We will of course keep you informed
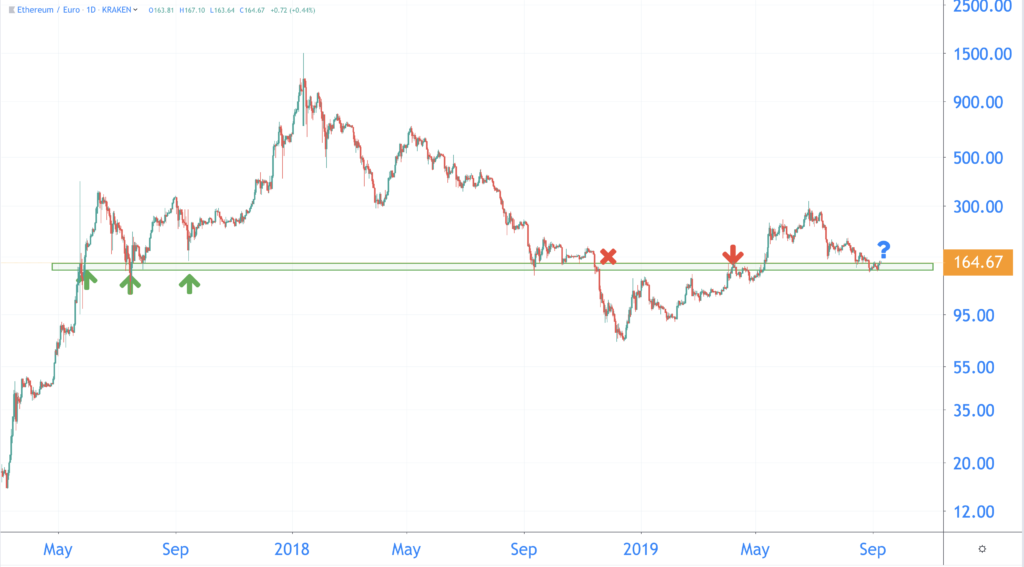
This is also the moment of truth for ether
What applies to litecoin also applies to ether. The cryptomint of the Ethereum network has collapsed considerably since mid-June and is now back in the 2018 support zone. You can see it again on the graph below with the green bar:
In the beginning of 2019, the price of ether was perhaps even boosted by the hype surrounding an update on the Ethereum network. Ethereum received an update in February this year for the first time since October 2017.
That was not without a struggle, the so-called Constantinople update has been postponed several times. On Thursday, February 28, the update was finally a fact. Then the course of ether slowly found its way up again.
Together with bitcoin and litecoin, ether reached its pinnacle on 26 June. For a moment ether was worth more than 300 euros, the highest point since 10 August 2018. But that did not last long, ether is back in the support zone of 2018.
In short, compared to altcoins, bitcoin is not doing so badly yet. The price is still at a higher level than the support zone of 2018.
Related posts:
 Why do cryptocurrency Exist – Institutions
  Bitcoin and independent property rights
  NASDAQ on market manipulation: Everyone is now talking about regulating bitcoin and cryptocurrency
  Pilot Porsche on Ethereum blockchain to trace provenance materials
  Xfers from Singapore is going to use blockchain Zilliqa
  Make your own tokens with the Guarda wallet


