


Did you buy bitcoin yesterday at 9:18 PM and sold it two minutes later? Then you would have taken a three percent profit. It can go that fast.
And yesterday the bitcoin rate rose from the bottom to the top by almost six percent, as you can see below:
But the party did not last very long, the course collapsed quickly again. And at this moment the price is again in the same zone as the last two weeks.
Three important zones for bitcoin
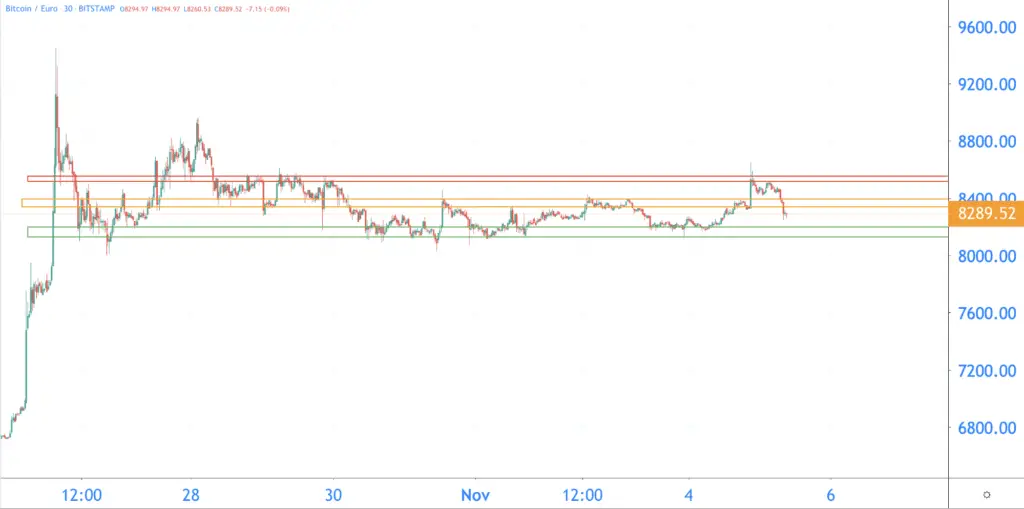
We zoom out again on the graph. You look at the rate from October 26 to now. Please note, the graph is focused on the short term. Each candle represents half an hour.
The course now moves mainly sideways. We can find three important zones on the graph:
- The red bar is a strong resistance around 8,500 euros.
- The orange bar was a support in the beginning and now appears to be a resistance. This zone is around 8,350 euros.
- The green bar is a strong support around 8,150 euros.
Since October 30, the bitcoin course has moved smoothly between the green and orange bars. Last night the race shot through the orange bar with a lot of violence. But the red resistance turned out to be too strong. And at this moment we are back again.
Price is being squeezed
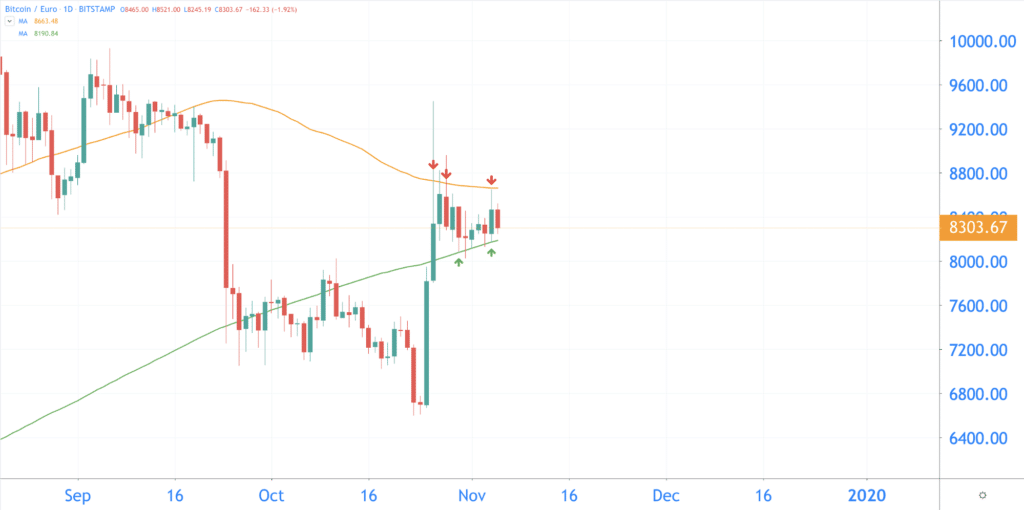
Bitcoin does not seem to be heading in a clear direction. And you can see that in a different way. The course is being squeezed between two Moving Averages. And that gives mixed signals.
On the one hand, the exchange rate is supported by the 200-day Moving Average. That is the green line on the graph. That support is positive, for many investors it gives confidence that bitcoin is back in the bull market.
But on the other hand, the bitcoin just can’t get above the 100-day Moving Average, the orange line on the graph. Last night the course found a resistance on this line. And that can be a bad sign again.
And does the 100-day Moving Average fall below the 200-day Moving Average? Then you speak of a death cross, and that may mean a fall in the longer term. But it is not that far yet, and if the price continues to be supported by the 200-day Moving Average, the lines will not cross.
It still looks good in the long term
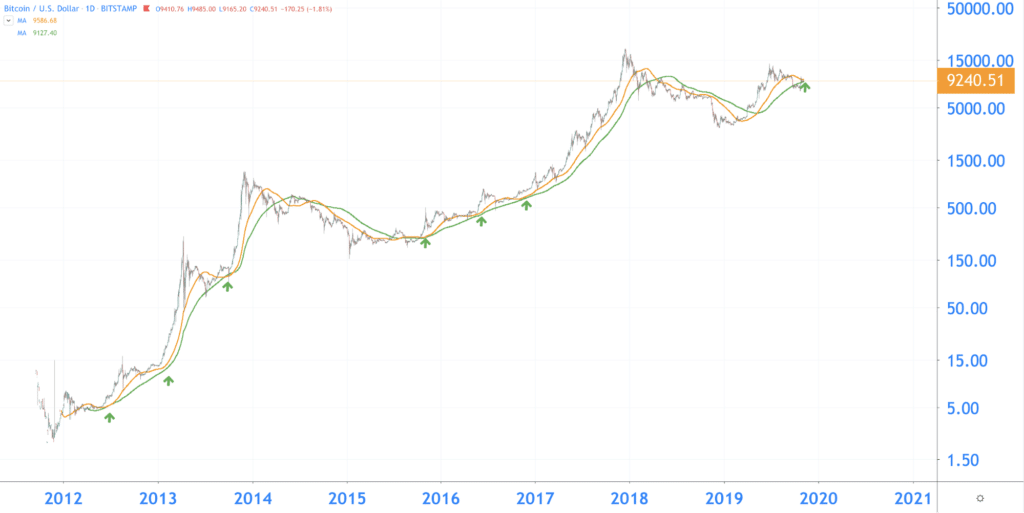
We zoom out the graph much further. You can still see the two Moving Averages, but from 2012 to the present.
Will the bitcoin rate rise above the 100-day Moving Average in the coming days? Then that is positive. In a bull market, the 100-day MA looks up the 200-day MA more often, from this point on, the price makes a new move up.
If this pattern repeats itself, then we can expect another rise in the coming days.
Bull flag in the making?
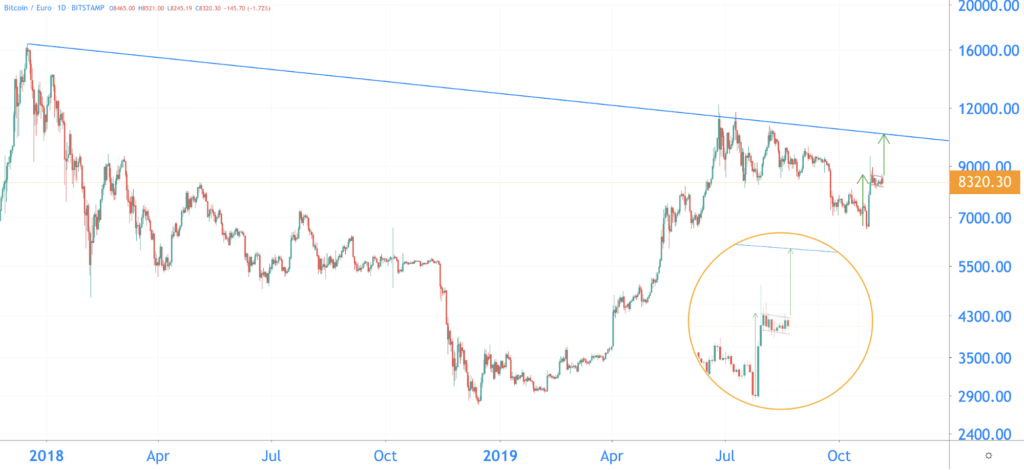
And there is something else that can turn out positively, and that is a bull flag. A bull flag is a price formation that in most cases leads to a price increase.
You can recognize a bull flag like this:
- First the course makes a huge move up. That is the mast of the flag.
- Then the price moves downwards between two trend lines.
- Does the course break out at the top? Then the rise is just as large as the flag’s mast.
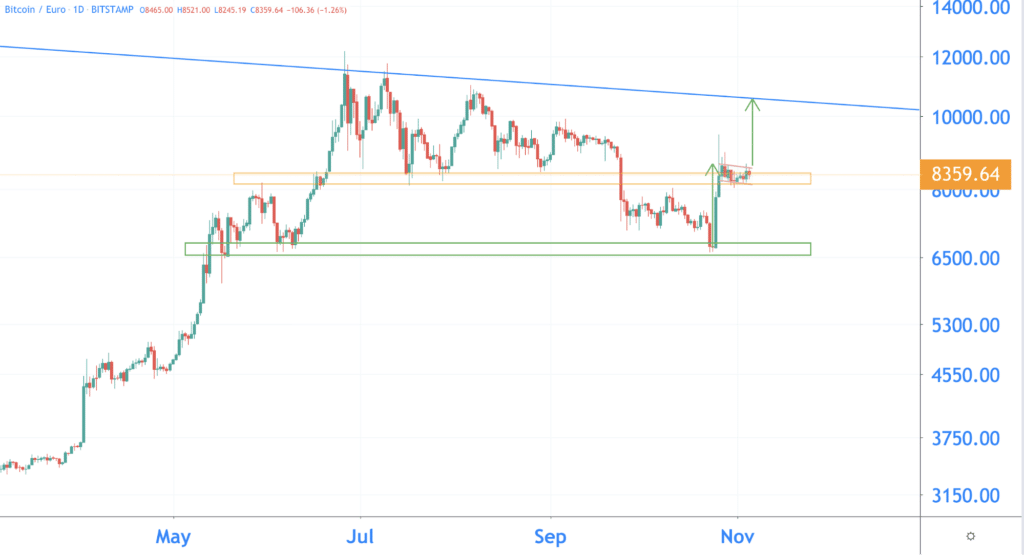
And with this rise, the bitcoin rate can look for an important trend line (in blue). We draw the line from the summit from the end of 2017 until now. You can see that this line has become relevant since June this year. It may well be that this line becomes relevant again in November!
What can we expect from the bitcoin rate?
The price of bitcoin now seems stable, but with bitcoin it can go fast. We saw that two weeks ago (26 October) too! Our scenarios for this week are based on that.
Bullish
In this scenario, the price support will continue to be found on the orange zone on the graph. Is the bull flag coming out? Then the rate of bitcoin can find resistance at around 10,500 euros. That price corresponds to the large falling trend line since the end of 2017.
Bearish
But is bitcoin falling? Then bitcoin finds support around 6,700 euros. That is the bottom of two weeks ago. And also in May this year it was an important zone.
Win a Ledger Nano S!
Is your glass bulb doing better? Predict the bitcoin course and win a Ledger Nano S hardware wallet! A hardware wallet is a device with which you can safely manage your bitcoin and other crypto coins. A must-have for every crypto enthusiast ?
What should you do? Predict the rate in euros November 7 at 11:59 PM Dutch time. You can respond up to and including Wednesday 6 November at 12:00 noon.
You can respond to the news article and under the comments of the YouTube video.
Game rules
- Use the bitcoin rate in euros on our rate page: https://btcdirect.eu/nl-nl/bitcoin-koers
- You must be at least 18 years old to participate
- Edited responses are not included
Related posts:
 GitHub Libra Code draws criticism from users
  Tipping on Reddit and Vimeo in BAT introduced by Brave
  Newcomers to the crypto market have to pay attention to scams and pump and dumps
  Hardly any growth in downloaded crypto apps, despite tripling price bitcoin
  Bloomberg accepts Bitcoin – says cryptomonads are here to stay
  The Central Bank can release their cryptocurrencies earlier than expected


