


That went quickly! In a day, the bitcoin rate rose and fell by five percent. If that happens on the stock market, you would fall off your seat in surprise. But with bitcoin that is normal. Also during Christmas.
Double bottom is positive
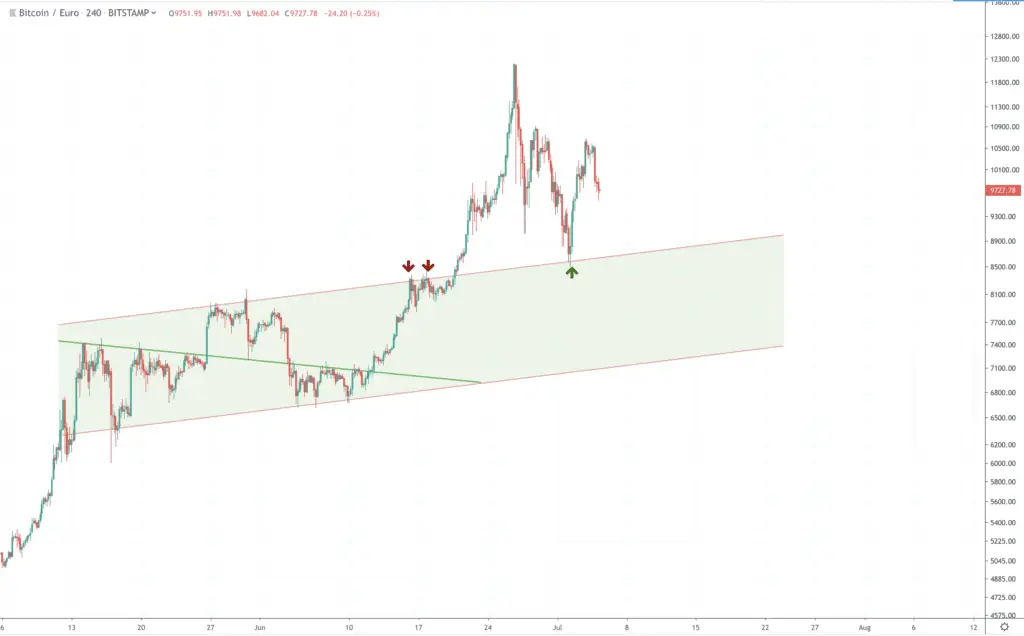
Back to the analysis! The rate has now fallen somewhat, but compared to the bottom of last Wednesday (second circle on the graph), bitcoin is still in the plus with more than twelve percent.
That bottom of last week is almost at the same level as the previous bottom of November 25 (first circle on the graph). You call that a double bottom in the technical analysis.
And that is often a good sign. This may mean that the downward trend of recent weeks is over, and that the rate may rise in the longer term.
Stop! Hammer time
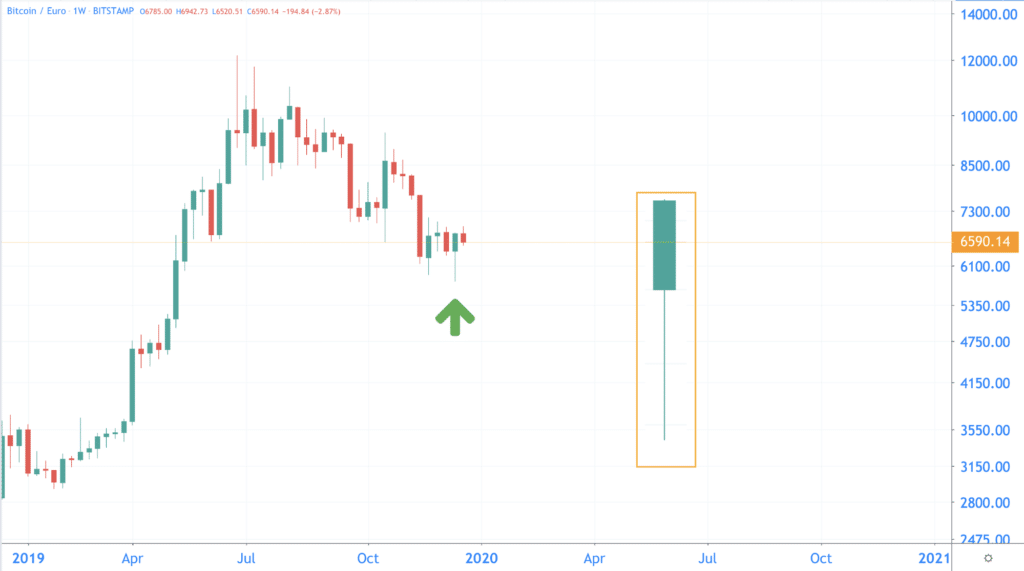
We also see something positive at the weekly level. Last week’s candle has the shape of a hammer. This has a long wick (stripe) and a relatively short body (green rectangle). Do you see this after a fall in prices? Then that can indicate a bottom, and thus the start of a new rise.
Indicators give hope
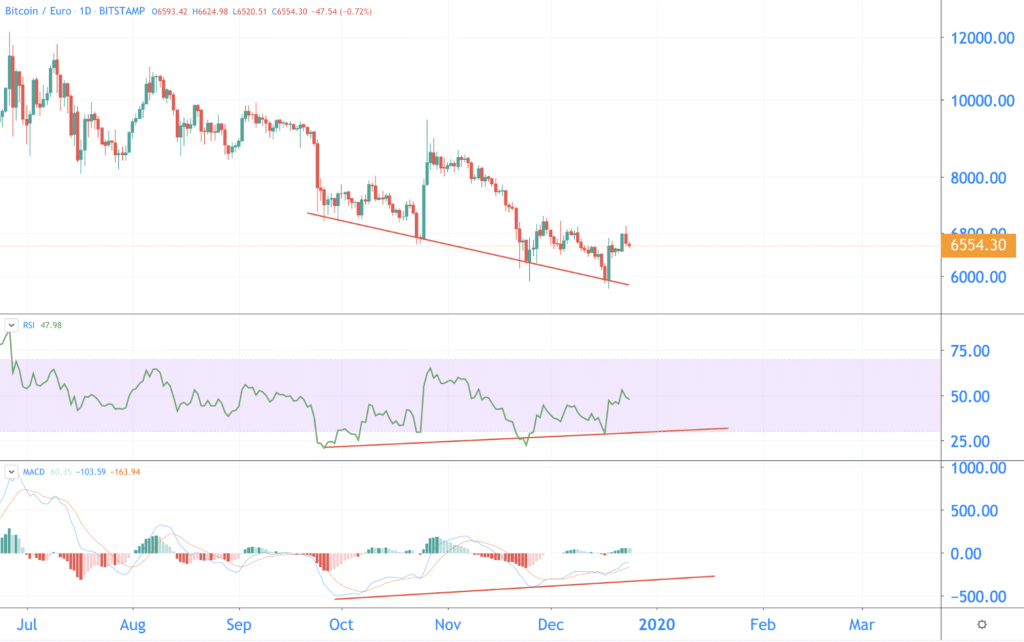
The RSI and MACD also show that the price can rise in the longer term. You look at the bitcoin chart at day level, you see the rate from July to now.
The rate makes a falling movement, but the RSI (second graph) and the MACD (lower graph) rise. You call that divergence. Or in less expensive words, the price moves differently than the indicators. And that too is a sign that the trend can reverse.
Stuck in channel for half a year, this time out?
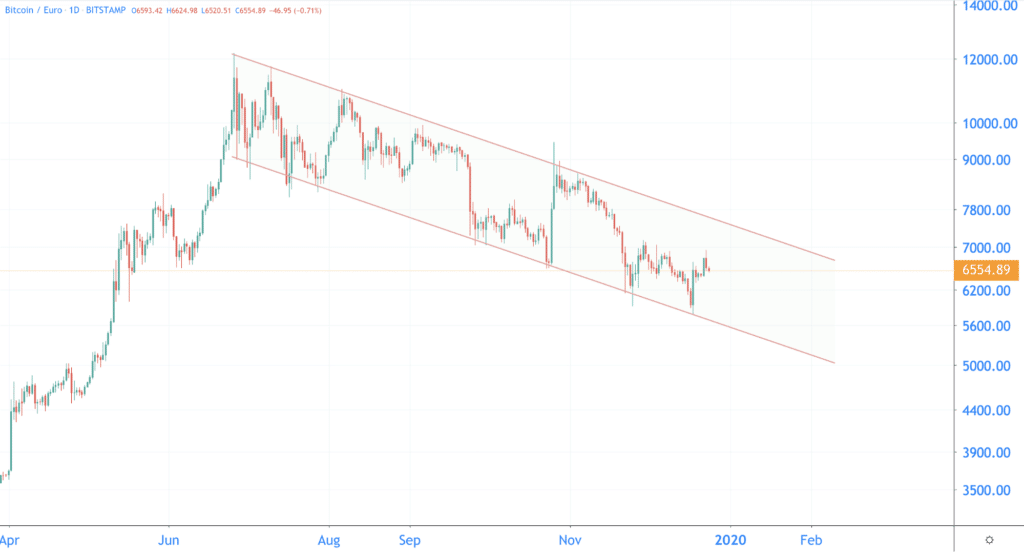
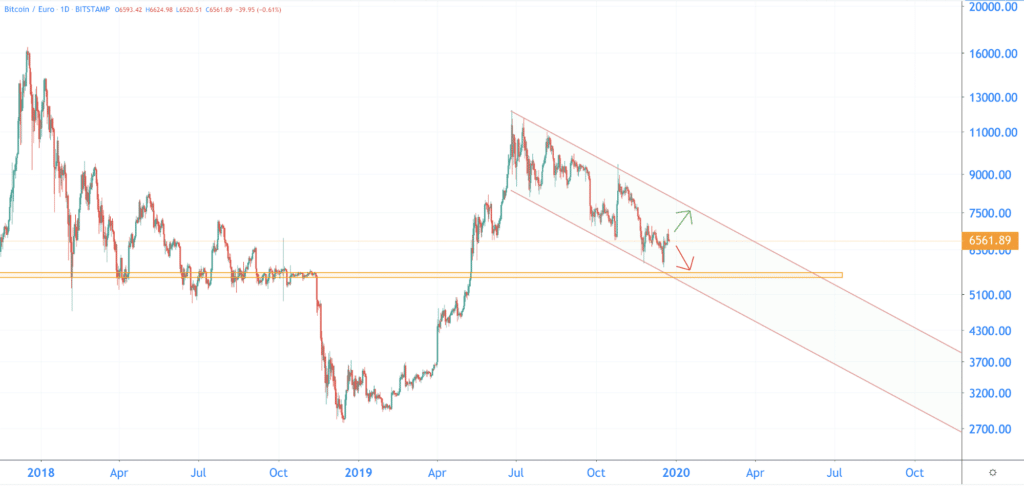
But the reality is that the price has been moving for half a year between two falling trend lines, you call that a channel.
Will the course be able to break out of this channel this time? The double floor, the hammer and the divergence certainly give hope.
If the bitcoin rate wants to break out of the channel, bitcoin must reach a value higher than 7,800 euros. That is equivalent to the top trend line.
You would say that this cannot continue indefinitely ?
What do we expect from the bitcoin rate?
Nice cliché, but it can go either way. And that is why, objectively as we always are, we discuss two scenarios. Positive (bullish) and negative (bearish).
Bullish
The largest threshold is now the top of the channel, around 7,800 euros. Does the course break out of the channel? Then the peak of 2019 is in sight again, at 12,200 euros.
Bearish
In the negative case, the rate first drops back to 6,000 euros. That is the bottom of last week. Slightly below is an important support (the orange bar on the graph). This zone is around 5,600 and provided strong support in the first half of 2018. The rate does not have to collapse like a (Christmas) pudding.
Related posts:
 GitHub Libra Code draws criticism from users
  Tipping on Reddit and Vimeo in BAT introduced by Brave
  Newcomers to the crypto market have to pay attention to scams and pump and dumps
  Hardly any growth in downloaded crypto apps, despite tripling price bitcoin
  Bloomberg accepts Bitcoin – says cryptomonads are here to stay
  The Central Bank can release their cryptocurrencies earlier than expected


