


Things are going well at the Nijmegen Four Days Marches, but you can’t say that yet about the bitcoin course. After a month long rise, the bitcoin engine starts to falter a bit. At the time of writing, the value has fallen below $ 10,000.
But the tide seems to be turning, yesterday and today the price of bitcoin is rising again. Is this the end of the fall in prices in recent days? Or can we expect a further fall?
Bitcoin price below Moving Average ..
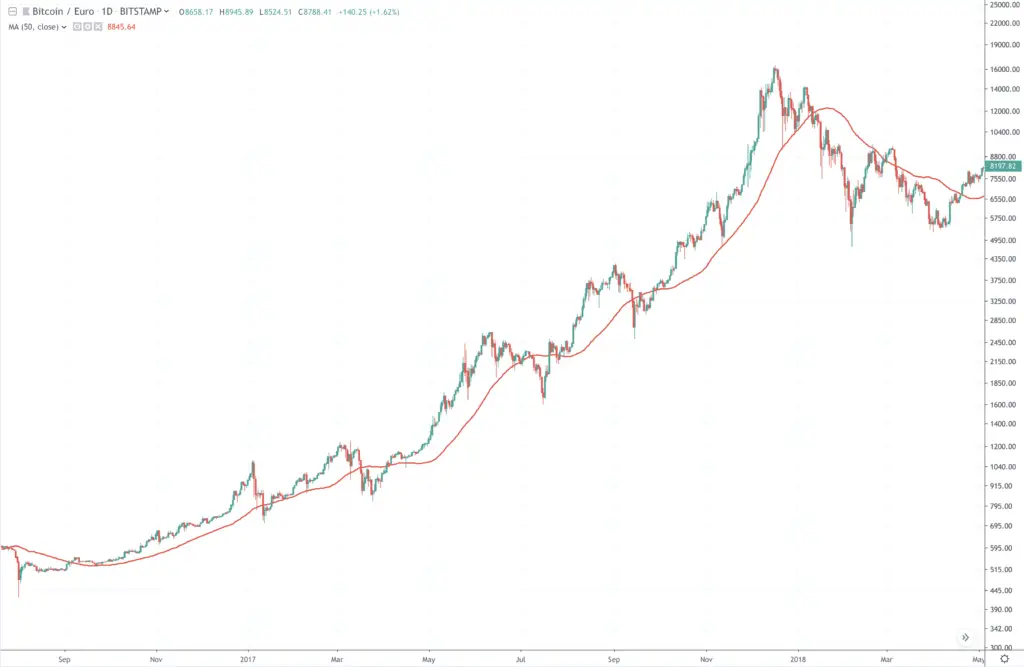
For the first time since February 2019, the bitcoin rate has fallen below the 50-day Moving Average (MA). On the graph below you can see the MA in red. Each candle on the chart represents one day. You look at the rate from July 2018 until now.
The MA line serves as support in the period after February. The value of bitcoin is difficult. We have indicated this on the graph with the green arrows.
But at present the value of bitcoin is lower than the MA. Does the MA now serve as a resistor? Or is this just a temporary correction? To understand that, we look at the previous bull market, in 2017.
..but that happens often in a bull market
Also in 2017 the course sometimes went under the MA. The rate cannot go up in one oblique line, there are always some corrections.
The rate therefore often fell below the 50-day MA. They were often major corrections, between thirty and forty percent. That is comparable to the situation today. But in the end the bitcoin rate recovered from this fall, and even rose to a high of more than 16,000 euros.
Returning to now: this may also be the case at the moment. Since the previous summit on Wednesday, July 10, the value of bitcoin has fallen by more than thirty percent. In addition, the value is now below the 50-day MA.
Is the correction now over? That could be just like that, but of course we should not cheer too early. Or cry, if you have agreed with yourself to buy at 7,000 euros.
Bitcoin course back in an old channel?
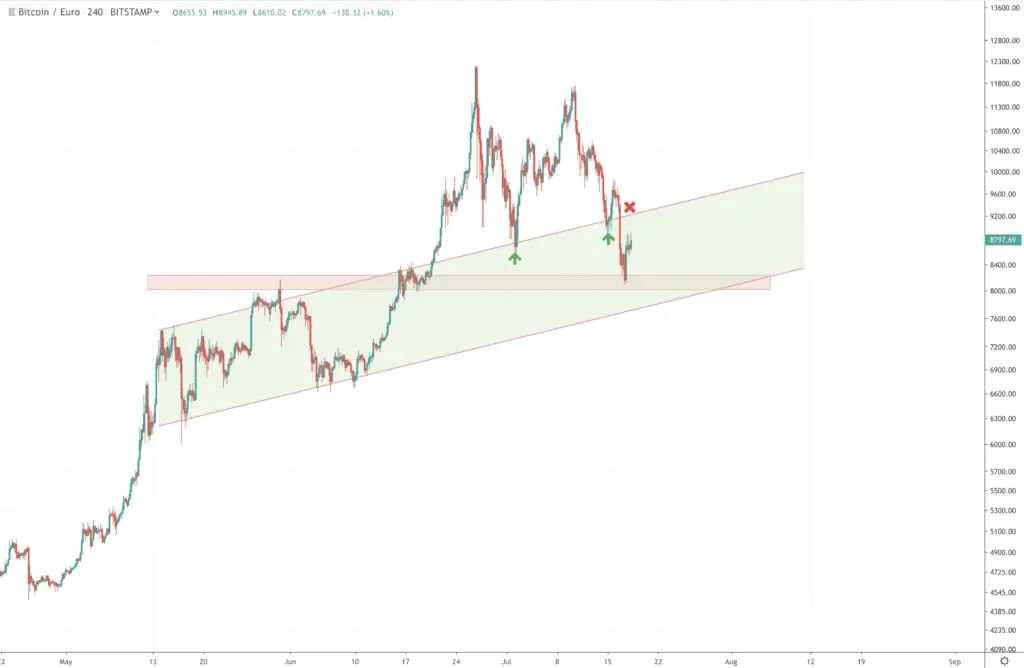
From May to June the bitcoin course moved in a channel. A channel consists of two parallel trend lines. You can see that on the graph below. The course bounced up and down between these two lines.
At the end of June the bitcoin course broke out of this channel. At that moment it seemed as if the channel would no longer be relevant.
But in July the price fell to the top of the channel. We have indicated this on the graph with the green arrow. At the second valley the course hit the top again (second green arrow).
And now the bitcoin rate is back in the “old channel”. It also seems that the course has found support on the red bar. This level has been an important zone in recent months. At the beginning of June this was primarily a resistance, after support at the end of June.
Fibonacci zones also remain relevant for the course
Fibonacci also remains relevant to the bitcoin course. The Fibonacci series still give the resistances and supports flawlessly.
Fibonacci was an Italian mathematician who described a simple series of numbers in the 12th century. This series of numbers is now used everywhere to describe natural proportions. For example in the field of film and photography, but also on technical analysis.
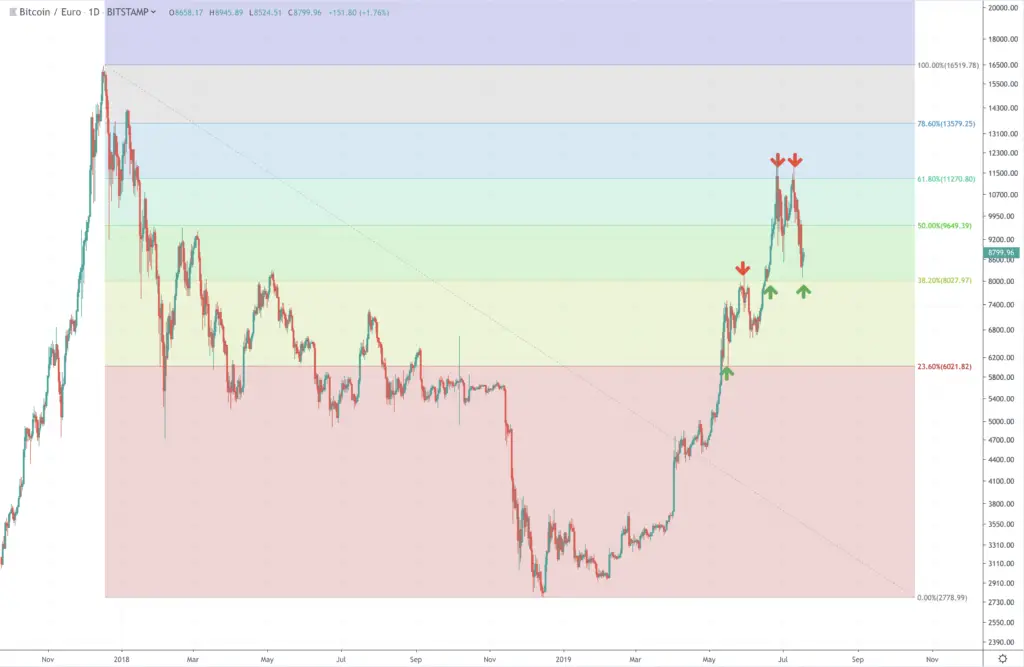
In the technical analysis you draw the Fibonacci retracement from the top to the bottom. The numbers on the right indicate the percentage of the decrease that has since been made up.
You can see that clearly on this graph. We have indicated the resistances with the red arrows, the supports with the green arrows. The two tops were at the 61.80% Fibonacci level. The exchange rate has recently found support at the 38.20% Fibonacci level.
The next level to keep an eye on? The 50% Fibonacci level, which is around 9,650 euros. It is quite possible that the bitcoin course will encounter resistance there.
Where does the bitcoin course go?
In the time that one half of Nijmegen was walking and the other half partying, the bitcoin had to give up a lot. Will bitcoin continue to fall? Or was this the end of the correction? As always, we have two farm-fresh scenarios for you: bullish (positive) and bearish (negative).
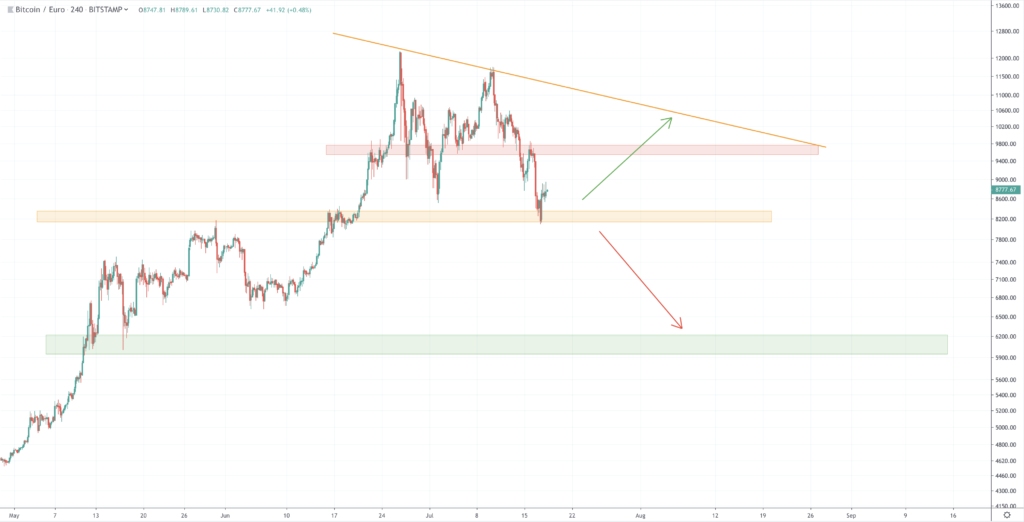
Bullish
If the bitcoin price rises, the price will probably first encounter resistance on the red bar. This coincides with the 50% Fibonacci level that we have just discussed. Can we expect a further rise? Then the oblique orange trend line forms a resistance. In that case, 10,500 euros is an important level to monitor.
Bearish
For the bearish scenario it is good to keep an eye on the yellow bar. That is the zone where the bitcoin course last found support. Is this zone broken? Then, in the most negative scenario, a decrease towards 6,000 euros is imminent (the green bar on the graph). This zone meets the 23.80% fibonacci level.
It will be exciting anyway .. a nice trade weekend!
Related posts:
 GitHub Libra Code draws criticism from users
  Tipping on Reddit and Vimeo in BAT introduced by Brave
  Newcomers to the crypto market have to pay attention to scams and pump and dumps
  Hardly any growth in downloaded crypto apps, despite tripling price bitcoin
  Bloomberg accepts Bitcoin – says cryptomonads are here to stay
  The Central Bank can release their cryptocurrencies earlier than expected


