


It is hot outside and bitcoin looks like a siesta. The course has been moving sideways for days, not much exciting has happened. However, this may change in the coming weeks. In this analysis we not only look at the short term, but we also look ahead to the coming months.
Again that triangle?
Sorry, but he remains relevant. We will say the power of repetition!
The situation in the short term has actually remained unchanged since our last price analysis. The price of bitcoin moves between two trend lines that move towards each other. We have drawn these trend lines in orange on the graph. The graph is focused on the short term, each candle represents four hours.
The question remains: does the price break out at the bottom or top? The trend lines come together around mid-September. In the most boring scenario, the question remains unanswered until then.
Then in the longer term
If bitcoin stays within the lines, then the coming weeks will not be as exciting. That’s why we zoom out the graph.
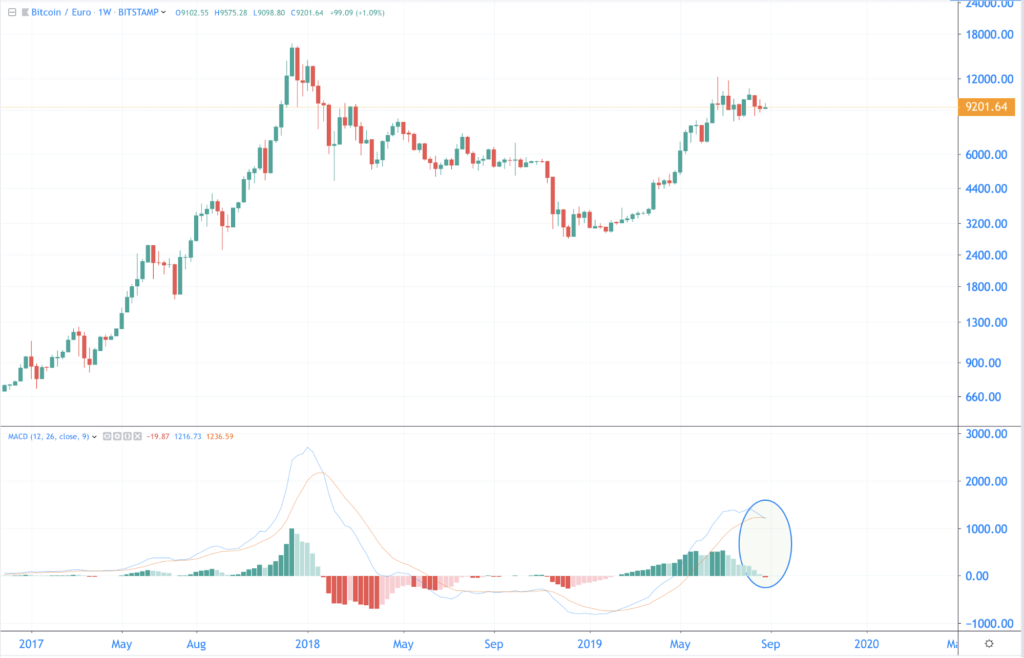
You see two things below. Above you see the bitcoin rate in euros. Each candle on the graph now represents one week instead of four hours. You also look at the bitcoin rate from 2017 to now.
The MACD is shown below. The MACD shows the difference between Moving Averages. The MACD indicates the direction of the trend in most cases. In simple words: green for a rising trend, red for a falling trend.
At the weekly level, the MACD turns red for the first time since February. This change of green is called a bearish cross. But is this bearish cross bad?
In early 2018, the MACD also turned red. That was the start of the bear market. But it doesn’t have to come to that. In a bull market, a bearish cross can actually indicate a temporary bottom. The rate then rises again afterwards.
The graph below shows how that works. Note: the graph is expressed in dollars, because we can look further back in time with this currency. Every time the MACD turns red you expect a long-term decline. But in a bull market that decline is not achieved, the correction has already taken place.
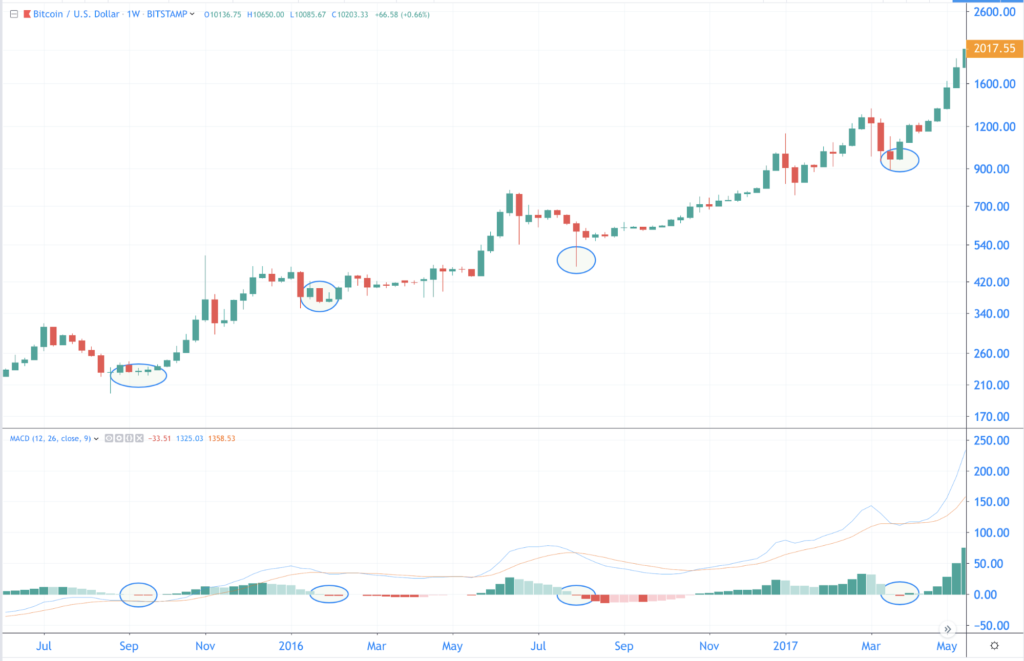
Has the bitcoin rate now also found a temporary bottom? That is very possible.
Koers finds support on RSI
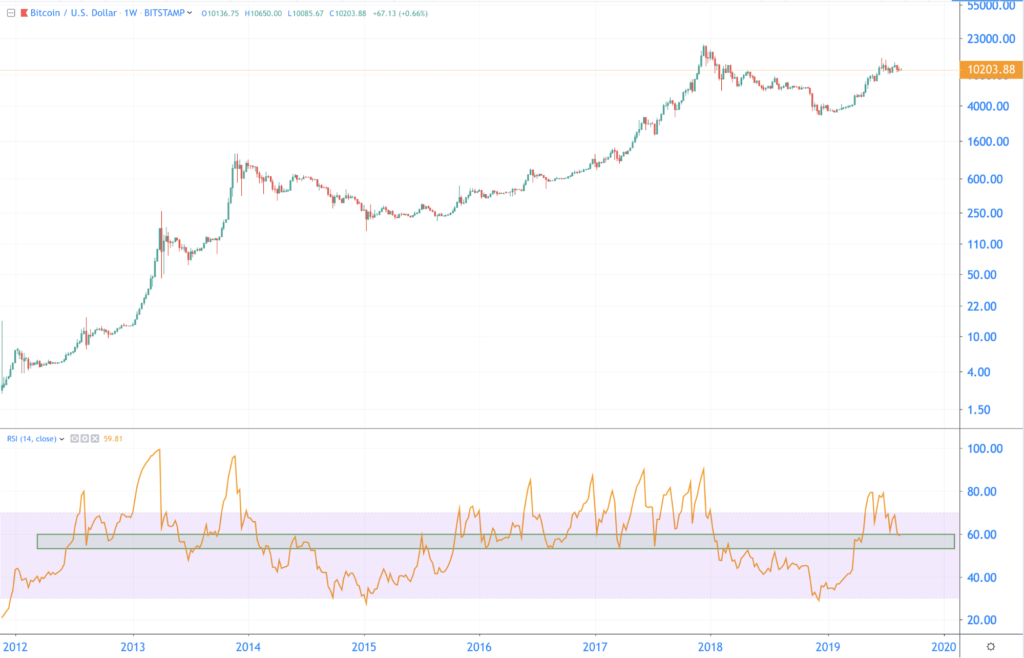
Another indicator also indicates that bitcoin is still in a rising trend. On the bottom graph you look at the Relative Strength Indicator, or the RSI. This indicates the momentum of the price.
Simply put: a value above 50 is a positive trend. Below that the price is in a negative trend.
And that turns out to be pretty good at bitcoin. In a bull market, the RSI generally does not fall below 53. You can say that the RSI finds support there. This was the case in 2012 up to and including 2014, and also in the bull market of 2016 and 2017.
Now the line is still at the top of the support zone, the RSI is now around 60. Bitcoin can therefore drop somewhat in the somewhat longer term. The bottom of the RSI at the weekly level is around 53.
But does the RSI remain above 53 on a weekly level? Then the rising trend of 2019 remains intact.
Well what will it be? For a major price movement, we probably still have to wait until September. In the long term, bitcoin still has a strong foundation for continuing to increase in value. We wait and see!
Related posts:
 GitHub Libra Code draws criticism from users
  Tipping on Reddit and Vimeo in BAT introduced by Brave
  Newcomers to the crypto market have to pay attention to scams and pump and dumps
  Hardly any growth in downloaded crypto apps, despite tripling price bitcoin
  Bloomberg accepts Bitcoin – says cryptomonads are here to stay
  The Central Bank can release their cryptocurrencies earlier than expected


