


News about bitcoin can have a lot of influence on the price. Uncertainty can cause the price to fall, and good news can make the price rise. Consider for example the announcement by Bakkt, or Donald Trump who has something to say about bitcoin. But in the technical analysis we leave the news for what it is and we look purely at the graphs. Is bitcoin again rising to 10,000 euros or are we sinking to 7,400 euros?
No time to read the price analysis? No problem! You can talk to Axel in three minutes:
Bitcoin at the point of outbreak
We start with the bitcoin course, also zoomed in considerably. You look at the four-hour graph. That means that each bar on the graph represents four hours. The graph shows the price movements from the end of June until now.
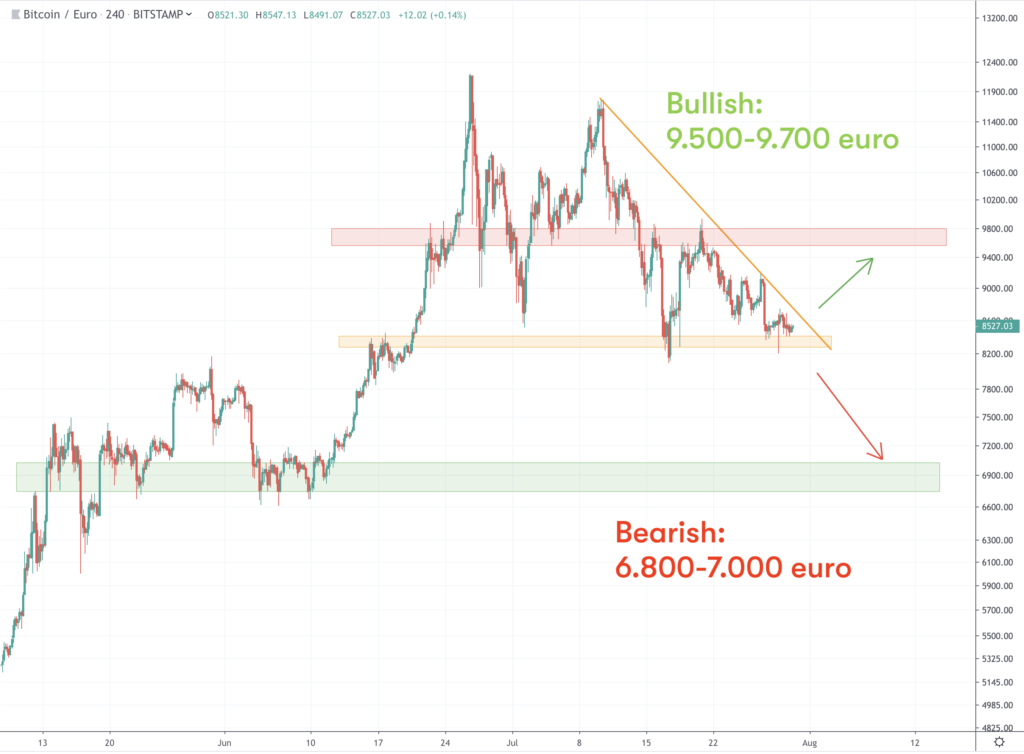
Since the big summit of 10 July (11,700 euros), the bitcoin rate has been in a downward trend. Bitcoin does not succeed in turning the tide. From July 10 to now, the rate has fallen by no less than 3,300 euros.
But there is also good news. The rate seems to have found temporary support between 8,200 euros and 8,400 euros. We have indicated this bottom on the graph with the green rectangle.
The course moves between the falling (orange) trend line and the support (green). The coming days will be exciting, especially at the moment when the orange trend line and the green support come together. Does the price break through the top of the orange trend line? Or does the rate fall under support?
Positive divergence may cause an increase
Positive divergence can have a positive effect on the course in the short term. Positive divergence means that the price shows lower bottoms, but that an indicator makes higher bottoms. On the two graphs below you can see that in the orange lines.
The indicator that we are looking at now is the RSI, the Relative Strength Indicator. This indicator shows the momentum of the price. You can read how the RSI works in this article.
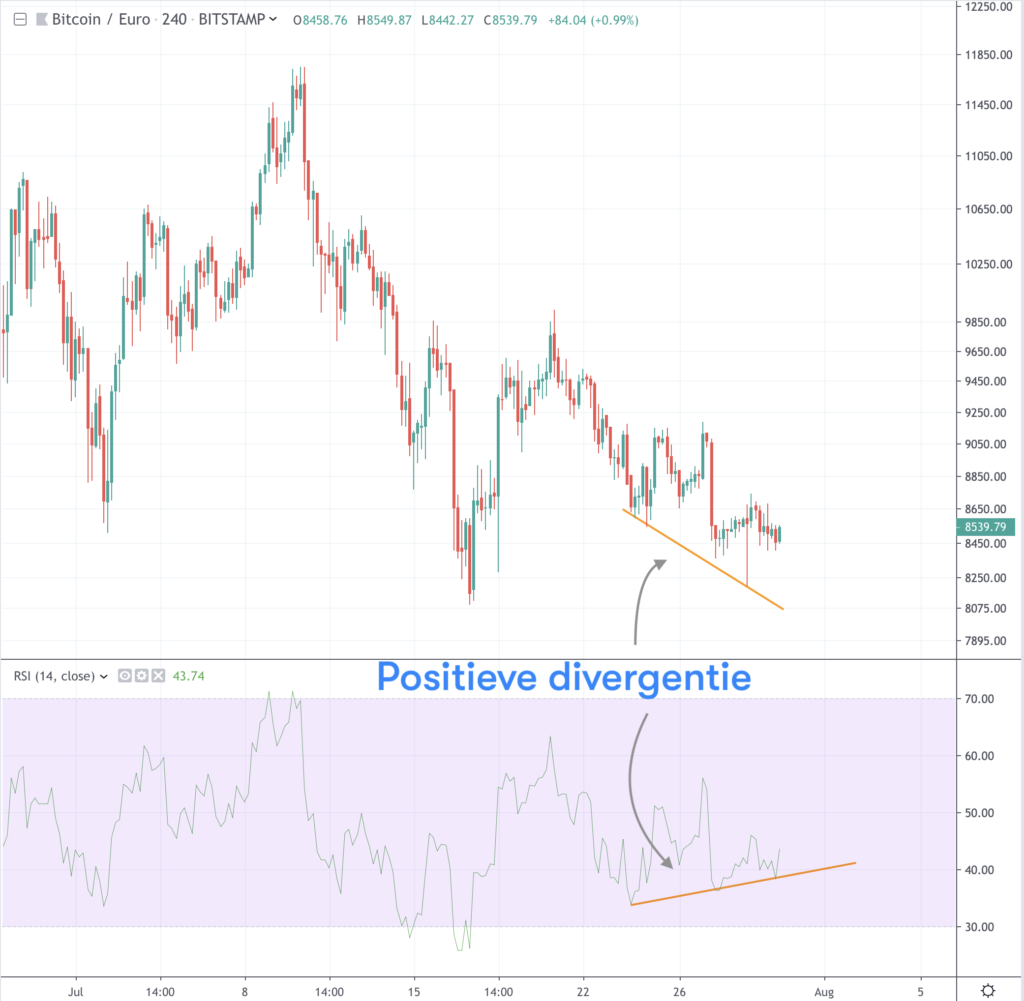
Most importantly, the difference between the movement of the bitcoin course and the movement in the RSI can be positive. Does this mean the end of the downward trend of recent days? Then bitcoin can just rise to 9,700 euros. That is the temporary summit a few weeks ago. Then the bitcoin course seemed to form an inverse head and shoulders.
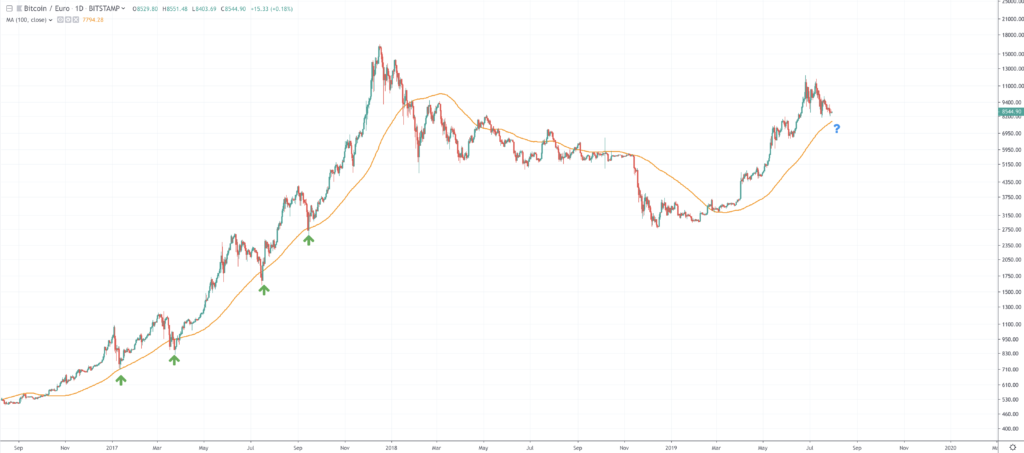
Moving Average can also provide support
Another indicator also indicates that the correction may soon be over. The Moving Average (MA) line can provide some support in the coming days. This means that the course touches the line and rises further from there.
In the graph below we look at the 100MA line on the daily graph. This line is indicated in orange. The graph is zoomed out considerably compared to the previous one. You look at the rate from mid-2017 to now.
The 100MA indicates the average price movement of the past hundred days. This line is updated every day. That’s where the Moving Moving name comes from: moving average.
The 100MA was also an important focal point in the 2017 bull market. Every time the rate searched the line, the value of bitcoin increased. We have indicated these price movements on the graph with the green arrows.
This is also a possible scenario now. Indeed, many agree that bitcoin is now again in a bull market. The price of bitcoin is now around 740 euros higher than the 100MA, this is around 7,800 euros. Does the value of bitcoin fall even further? Then the rate may find support on the orange line and the rate rises from there.
What can we expect from the bitcoin rate?
If we look at the RSI and the MA, it seems that bitcoin can rise in the coming days. But it remains bitcoin, so it can go either way. That is why we outline two possible scenarios for you: bullish (positive) and bearish (negative).
Bullish
In the positive scenario, the price rises above the trend line that we discussed at the start of the article. Bitcoin can then prepare itself for an increase towards 9,500 euros and 9,700 euros. The rate is likely to be resisted there. On July 15 and July 21, this was also a zone where the rate was difficult to top.
Bearish
But does bitcoin fall under support? Then the next important supporting level is only around 7,000 euros. This was the temporary bottom of early June, and it could be a basis for a new rise.
Exciting so the coming days! Keep an eye on our news platform for more price analyzes.
Related posts:
 GitHub Libra Code draws criticism from users
  Tipping on Reddit and Vimeo in BAT introduced by Brave
  Newcomers to the crypto market have to pay attention to scams and pump and dumps
  Hardly any growth in downloaded crypto apps, despite tripling price bitcoin
  Bloomberg accepts Bitcoin – says cryptomonads are here to stay
  The Central Bank can release their cryptocurrencies earlier than expected


