


If you just opened the laptop just before going to sleep last night, then you witnessed one of the biggest falls in times. You could say a good buying moment. But there are enough investors whose long position is closed. You just have to look at the numbers of BitMEX to understand how big this is.
Flash Crash
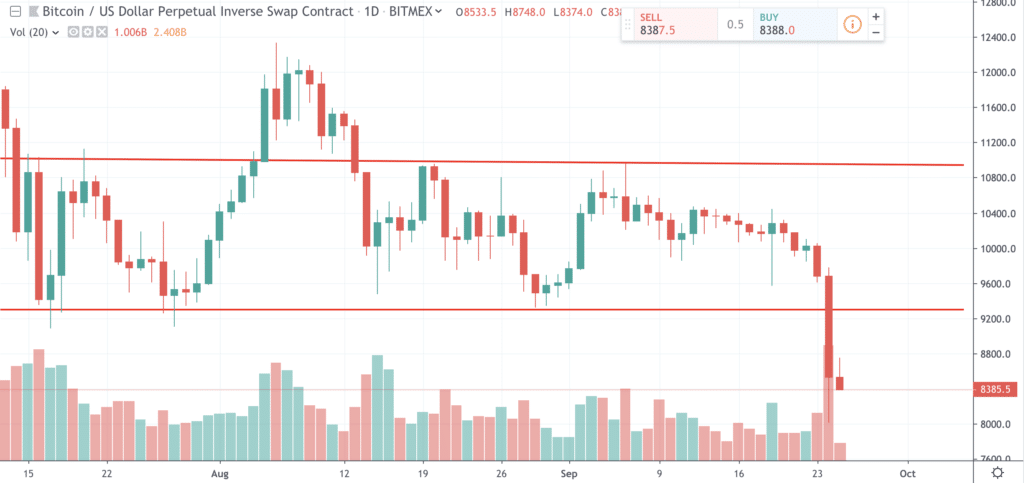
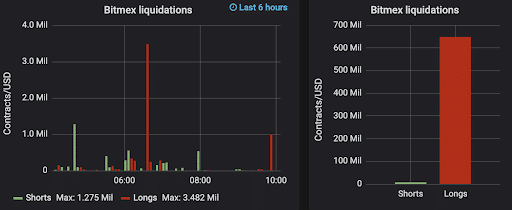
Bitcoin fell within a short time from 8,610 to around 7,537 euros, a price decrease of no less than 12.5 percent. According to the data on Datamish.com, more than six hundred million dollars in long contracts have been liquidated on BitMEX.
What about the liquidations on BitMEX?
It is unlikely that the liquidation round on BitMEX started the crash, but they did contribute to it. The figures of BitMEX are expressed in dollars, so the graph below is in dollars. Bitcoin had been struggling for a while between 9,300 and 11,000 dollars (indicated by the red lines).
When the course at the bottom of this zone broke, many long positions on BitMEX exceeded the margins. All these “lost” bitcoin are sold on the market and this led to a further and harder decline of the price. This is called a long squeeze. The long positions are squeezed out like a lemon.
You can also see that in the BitMEX chart below. On the right you can see that more than 600 million dollars in longs have been wound up.
Is this something to worry about? The leverage contracts on BitMEX can hardly be the initial instigator for a price rise or fall. But they can ensure that the price then falls or rises quickly. With that knowledge, it is interesting to monitor the effect of liquidated contracts on Bakkt, which potentially has billions of dollars going around.
Influence on sentiment
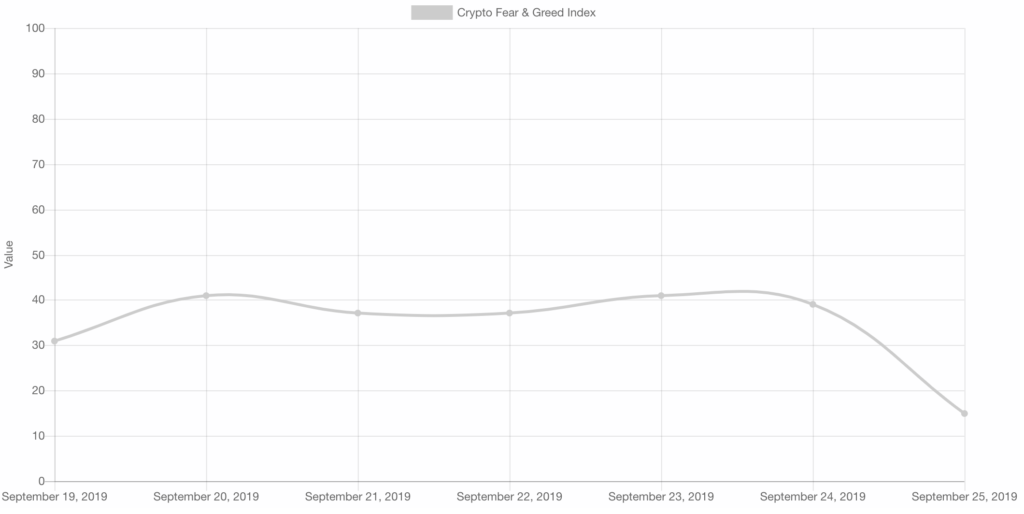
Sentiment has also fallen slightly. The alternative.me website has created a chart and metric for this called the Crypto Fear & Greed Index. This is a collection of different sentiment indicators that point to a slight movement in the direction of Fear.
According to the index, traders tend to become greedy when the market rises, often leading to FOMO. In addition, traders often sell in response to seeing red numbers. The Fear and Greed Index is intended to map those emotions. We look at social media, google trends, the market, volatility and a few more indicators. There are two simple assumptions:
- Extreme fear can be a sign that investors are too worried. That can be a purchase option.
- When investors become too greedy, this means that the market must undergo a correction. That can then be a sales moment.
The 0 stands for Extreme Fear and 100 stands for Extreme Greed.
Related posts:
 Why do cryptocurrency Exist – Institutions
  Bitcoin and independent property rights
  NASDAQ on market manipulation: Everyone is now talking about regulating bitcoin and cryptocurrency
  Pilot Porsche on Ethereum blockchain to trace provenance materials
  Xfers from Singapore is going to use blockchain Zilliqa
  Make your own tokens with the Guarda wallet


