


It now seems like silence before the storm for bitcoin. The rate doesn’t seem to be moving much, apart from the fall yesterday. But appearances are deceptive, often after such a period of stability a major price movement follows. Is bitcoin going to rise or fall in the short term? We analyze two scenarios in this analysis.
We are going to rise: a bullish pennant is causing a huge outbreak
Let’s start with the positive scenario! One possibility is that the price of bitcoin has been moving for months in a bullish pennant. And that can ensure that bitcoin will soon make a huge move up.
You look at the bitcoin rate in euros on a daily level, from July 2017 to the present:
A bullish pennant has the shape of a flag. First the course makes a big move up, that is the mast of the flag. Then the price moves between two trend lines. That way the formation looks a bit like a flag. Eventually the course at the top breaks out of the flag and the course makes a big move up.
The increase that follows is, according to the booklet, just as large as the flag’s mast. But from where you draw the mast is arbitrary. Are you starting with the big price increase in April? Or do you draw the line from May? In both cases we can expect an increase towards the highest price of bitcoin ever: 16,500 euros.
We are going to fall: RSI shows a negative trend
But of course it remains bitcoin, it can go in all directions. That is why we also describe a negative scenario. The Relative Strength Index (RSI) hints at a move down at bitcoin.
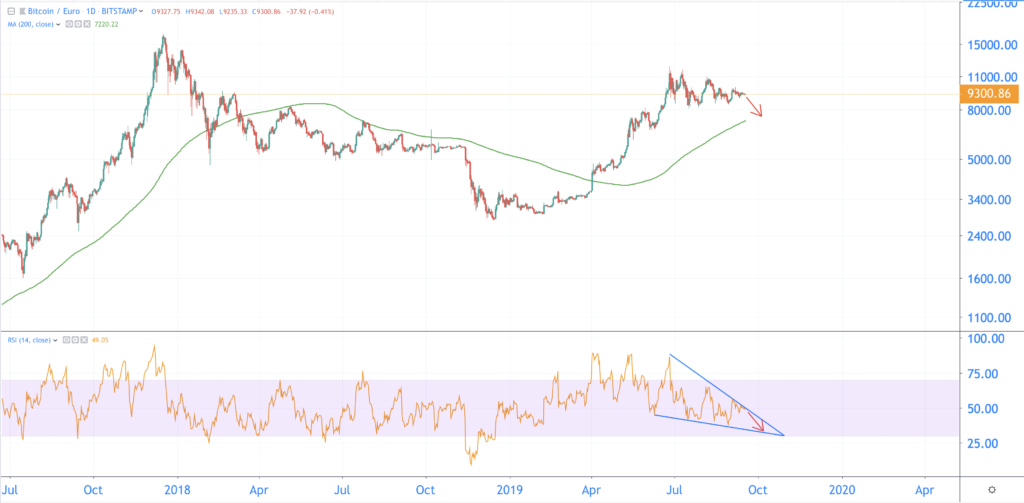
The RSI is an indicator that displays the momentum of the price. The RSI has been moving in a negative trend in recent months. The indicator shows lower tops and lower bottoms. You can see that from the blue trend lines on the bottom graph.
If this falling trend continues, the rate of bitcoin may go down in the coming days. The good news is that the 200-day Moving Average (MA) can serve as a support. In a bull market, the price almost never falls through this lower limit. This line is indicated in green on the top price graph.
If this scenario comes true, bitcoin can fall to 7,200 euros. The credits for this observation go to crypto trader Josh Rager on Twitter.
The market is certainly optimistic
It will be exciting in the coming days, what choice does the bitcoin course make? The opportunities are spread, both scenarios seem possible. But you can also always look at the opinion of others.
On exchange Bitfinex you can bet on a rise (long) or a fall (short) in the bitcoin rate respectively. And the difference between long positions (green) and short positions (red) has never been greater. Investors expect an increase rather than a decrease.
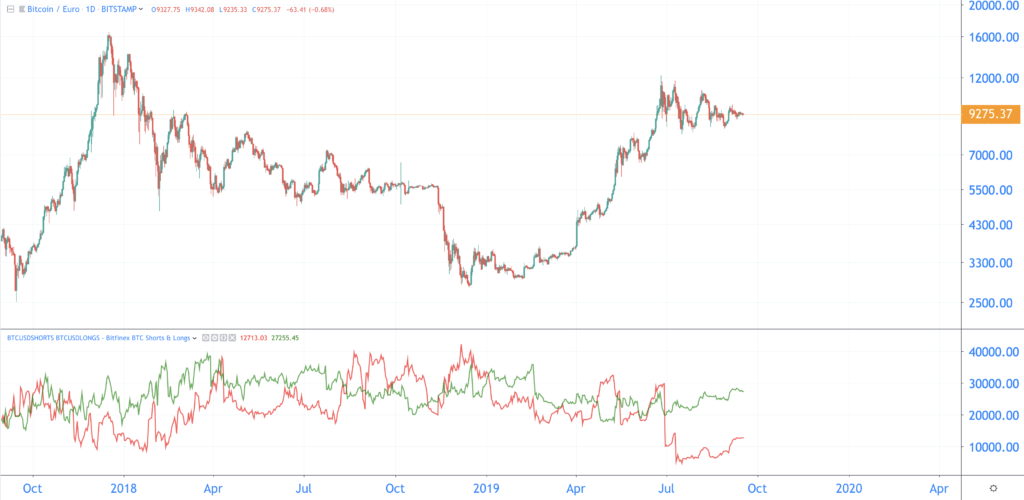
The market is therefore more positive than ever about the bitcoin rate. Traders are hoping en masse for a bitcoin price rise. But keep your head cool, it can go either way.
Keep an eye on our page for a new price analysis! Can’t you wait? No problem, follow the live bitcoin course on this page:
Related posts:
 Why do cryptocurrency Exist – Institutions
  Bitcoin and independent property rights
  NASDAQ on market manipulation: Everyone is now talking about regulating bitcoin and cryptocurrency
  Pilot Porsche on Ethereum blockchain to trace provenance materials
  Xfers from Singapore is going to use blockchain Zilliqa
  Make your own tokens with the Guarda wallet


