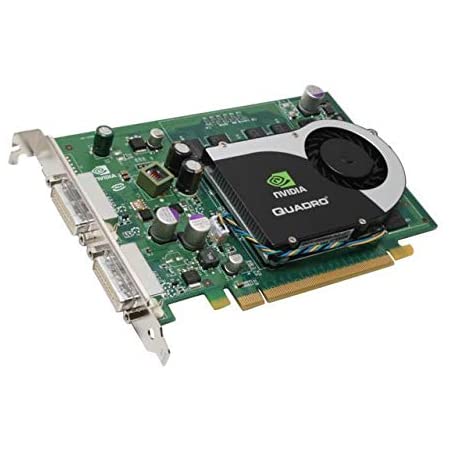
On July 22, 2003 NVIDIA announced a new “professional” card Quadro FX 3000 based on GeForce FX 5900Ultra. As always, the release of the new motherboard is accompanied by puffing up the cheeks on the part of marketers, followed by assurances of the “uncompromising” of the new product, its “universality” for prof. applications and even “uniqueness” (despite the fact that this very product, which costs thousands of dollars, differs from the game only in its drivers).
However, as before, we are only interested in one thing – speed and quality. The image quality depends on the drivers, and since they have not changed since the Quadro FX 2000, I send everyone to look at the screenshots. review this board. And in this article we will talk about speed characteristics. For comparison, I took several cards – Quadro FX 2000 (based on GeForce 5800 Ultra), FireGL X1 (based on Radeon 9700Pro) and a game card GeForce 5900Ultra (to show how optimized drivers can affect performance).
Test conditions
Hardware configuration:
Processor – Pentium 4 3.06GHz
Motherboard – Asus P4PE
Память – 1024Mb CL2 DDR SDRAM
Видеокарта – NVIDIA Quadro FX 3000, NVIDIA Quadro FX 2000, Ati FireGL X1, NVIDIA GeForce FX 5900 Ultra
Hard Drive – 30Gb Barracuda ATA V
Software:
Windows XP SP1.
3ds max 5 (OpenGL rendering), 1280×1024 32bit.
The size of the textures is 512×512 background, 256×256 material, unless otherwise specified.
Drivers: for NVIDIA boards – Detonator version 44.03, V-Sync off + Maxtreme 4.00.29 – for FireGL X1 version 1021.
Testing
Benchmark №1:
This benchmark tests a graphics card’s ability to update more than one 3ds max window at a time. Animation is played in all projection windows, and for greater load on the accelerator, various display modes of projection windows are enabled – from Wireframe to Smooth + Highlights.

Polygons: 40088
Light sources: 2
Projection Window Display Modes: Wireframe, Smooth + Highlights, Smooth + Highlights + Edged Faces
Test results:

Benchmark №2:
Here, video cards display animation in one window, during which the camera flies among the rocks and hills of the lunar landscape, consisting of four hundred thousand polygons displayed in Smooth + HighLight mode.

Polygons: 400008
Light sources: 1
Projection Window Display Mode: Smooth + Highlights
Test results:

Benchmark №3:
This benchmark is essentially a complicated lunar landscape from the previous benchmark. Now, in addition to the landscape itself, models of some aircraft have been added to the scene.

Polygons: 742128
Light sources: 1
Projection Window Display Mode: Smooth + Highlights
Test results:

Benchmark №4:
Benchmark testing the processing speed of multiple light sources. Since most video cards do not support more than 8 sources, this test and the next two contain 8 different types of light sources. In this test, 8 SpotLights move around to illuminate a geometric object:

It should be noted that displaying spotlights is much more resource intensive than displaying Omni and Directional lights.
Polygons: 60500
Light sources: 8
Projection Window Display Mode: Smooth + Highlights
Test results:

Benchmark №5:
The same object, only now it is illuminated by eight Directional light sources. Directional light sources in 3ds max 5 are the fastest, unlike the previous version of 3ds max.

Polygons: 60500
Light sources: 8
Projection Window Display Mode: Smooth + Highlights
Test results:

Benchmark №6:
Again the same object and again eight light sources. Now these are Omni-type sources, in terms of resource intensity “average” between Spot and Directional.

Polygons: 60500
Light sources: 8
Projection Window Display Mode: Smooth + Highlights
Test results:

Benchmark №7:
A scene with “light” geometry and a couple of lights that occupy the entire projection window is a good benchmark for the rasterization speed in Smoth + Highlights mode.

Polygons: 40088
Light sources: 2
Projection Window Display Mode: Smooth + Highlights
Test results:

Benchmark №8:
Benchmark showing the speed of video cards with a large number of textures. The file contains a lot of textures and a minimum of geometry.

Polygons: 224
Light sources: 2
Projection Window Display Mode: Smooth + Highlights
Test results:

Benchmark №9:
This benchmark emulates the work on the level of the game, as it contains enough geometry and textures. The animation is structured in such a way as to fully display the entire scene.

Polygons: 12548
Light sources: 5
Projection Window Display Mode: Smooth + Highlights
Test results:

Benchmark №10:
In this test, video cards show their ability to display textures on deforming geometry.

Polygons: 5048
Light sources: 1
Projection Window Display Mode: Smooth + Highlights
Test results:

Benchmark №11:
This benchmark shows the ability of video cards to handle transparent surfaces.

In 3ds max 5, in addition to transparency, only simulated by dithering, familiar to users of previous versions:

Added real transparency, implemented by mixing the pixel colors of the overlapping objects:

Transparency modes can be switched via the projection window setting panel:

It’s easy to guess that the more correctly implemented transparency will be slower.
Polygons: 39940
Light sources: 2
Projection Window Display Mode: Smooth + Highlights
Test results:


Benchmark №12:
In this benchmark, the camera flies among the rocks and hills of the lunar landscape, consisting of four hundred thousand polygons, familiar to us from benchmark # 2, but the projection window is displayed in Wireframe mode.

Polygons: 400008
Light sources: 1
Projection Window Display Mode: Wireframe
Test results:

Benchmark №13:
Scene from benchmark # 3, in Wireframe mode.

Polygons: 742128
Light sources: 1
Projection Window Display Mode: Wireframe
Test results:

conclusions
As you can see from the results, the significantly increased memory bandwidth (1700MHz and 1000MHz) at almost the same core frequencies (450MHz versus 466MHz) allowed the Quadro FX 3000 to lead in the overwhelming majority of tests. However, the need to sell a large number of Quadro 2000 motherboards (as you remember, most NV30-based motherboards were produced in a “professional” version) led to a delay in the release of a “professional” NV35-based product as compared to a gaming one. However, the competition for the latest generation motherboards is not over yet – ATI has not yet announced the FireGL X2 based on the Radeon 9800Pro, while in the case of this motherboard the speed gain relative to the current flagship X1 based on the Radeon 9700Pro will be much greater than in the case of the NV30 / NV35.
Related posts:
 Bitmain Antminer r4 Review – Benefits Profitability Payback Specification
  Nvidia GTX 1080 ti Hashrate – Review | Overclocking |Ethereum |Profit (sky high)
  Antminer S5 ASIC Hashrate – Review Profitability Payback Period
  Asic Antminer S1 Hashrate – Review | Test| Specs| Pros & Cons | Set-up|
  Miner Baikal Giant x11 – Hashrate|Profitability| Specs
  Radeon Hd 7970 Hashrate -Review|Profitability | Specs | Pros and Cons