


While you were working from nine to five yesterday, the bitcoin rate rose by more than five percent. For the first time in four days we therefore close a day in the green again. How does this price rise come about? And what else can we expect from bitcoin?
Bitcoin broken out of channel
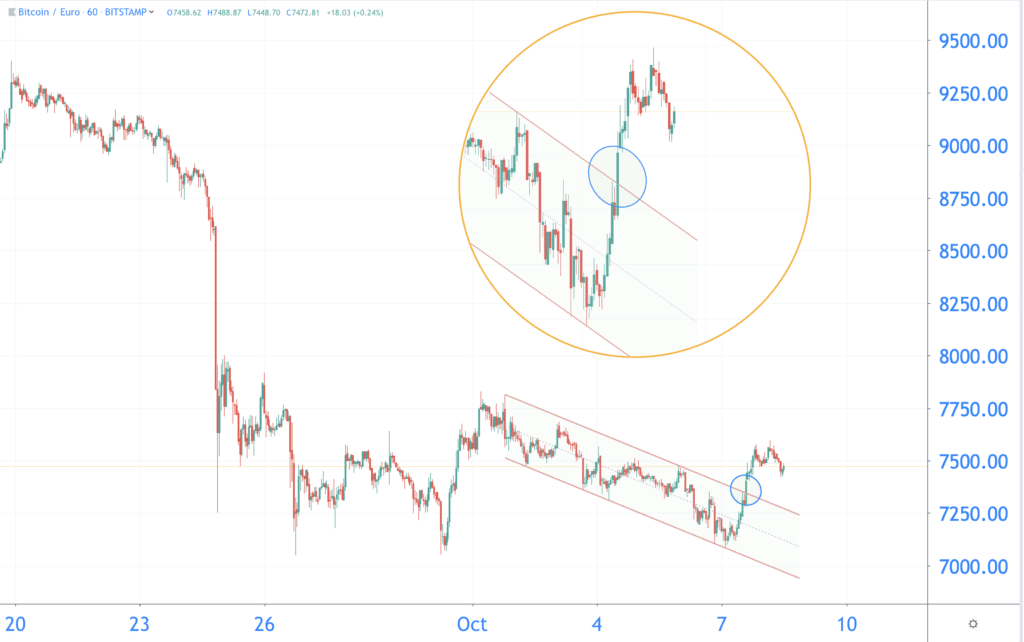
From the beginning of October the price of bitcoin moves in a downward channel. You can see that on the graph below. The course moves for a long time between two trend lines.
But yesterday the course from that channel broke. And usually something like this happens with a considerable movement, as happened yesterday. We have indicated this on the graph with the circle.
Does this outbreak mean that the downward trend of recent days has ended?
Bitcoin finds support three times in a short time
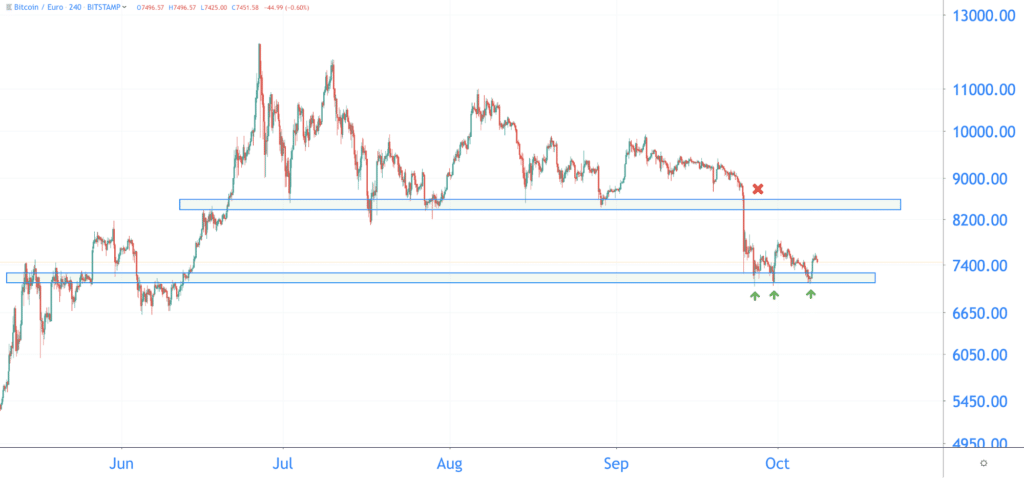
It is also striking that bitcoin has already found support at the same level three times. You can see that from the green arrows on the graph. This indicates that the zone between 7,100 and 7,300 euros is in any case a strong support.
Can we thereby say that we have found the bottom? That might be a bit premature. A while ago it also seemed to everyone that 8,500 euros was a bottom. And we all know how that ended. Hint: you can see that in the red cross.
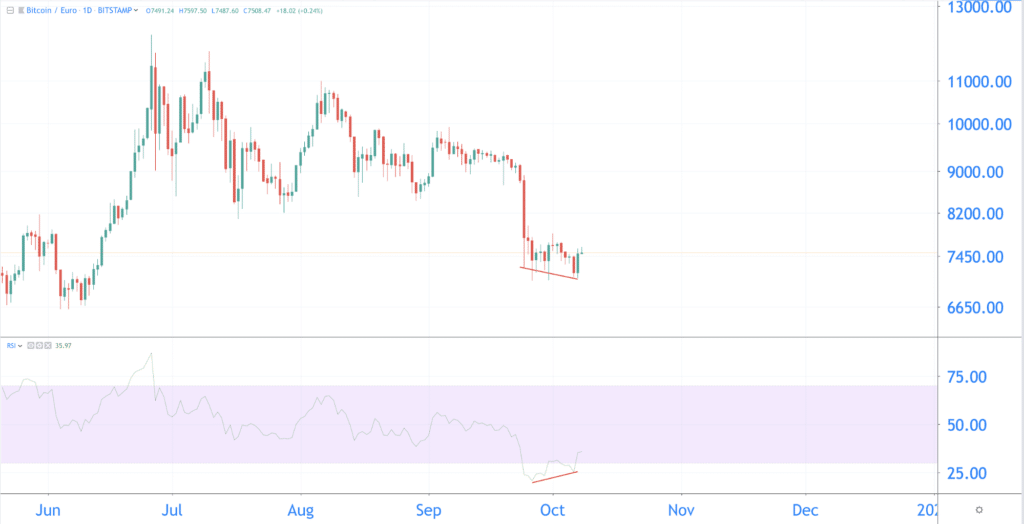
Divergence can cause price rises
We see something positive at day level in the form of divergence. The price drops and makes lower bottoms. But in the meantime, the RSI is showing higher bottoms. We call this difference divergence. This form of divergence is a positive sign, it can mean that the falling trend is being transformed into a rising trend.
What will the bitcoin course do now?
Bitcoin seems to end up in calmer waters since the fall. Which way is the course going now? We describe two scenarios again: positive (bullish) and negative (bearish).
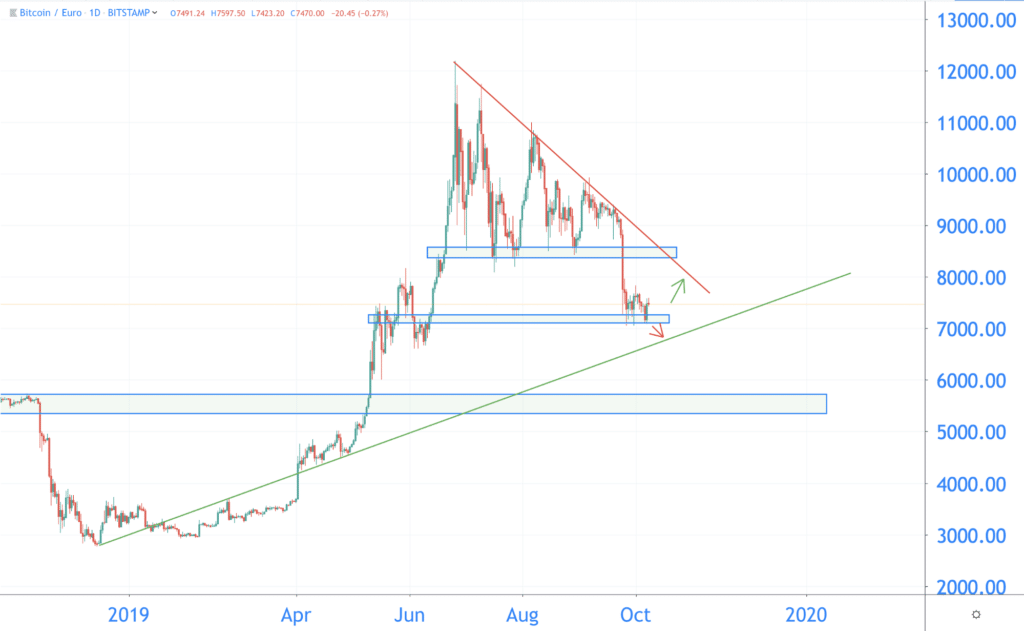
Bullish
Bitcoin rises in the coming days, then we find the first resistance around 8,500 euros. This is the old support from June to the end of September. In addition, it is also possible that the price encounters resistance with the falling trend line (red).
Is bitcoin breaking with both levels? Then that is a bullish sign. It may mean the end of the falling trend of recent months.
Bearish
The zone between 7,100 and 7,300 euros seems to be a strong support. But what if this support breaks? In the most negative scenario, bitcoin then drops to 5,500 euros. This level has proved to be strong support throughout 2018.
Related posts:
 Why do cryptocurrency Exist – Institutions
  Bitcoin and independent property rights
  NASDAQ on market manipulation: Everyone is now talking about regulating bitcoin and cryptocurrency
  Pilot Porsche on Ethereum blockchain to trace provenance materials
  Xfers from Singapore is going to use blockchain Zilliqa
  Make your own tokens with the Guarda wallet


